
The rise of new media has dramatically reshaped the educational landscape, particularly within higher education institutions, where the growing need for innovation and entrepreneurship has become central to preparing students for the future workforce. Innovation and entrepreneurship education, which aims to foster creativity, problem-solving abilities, and a willingness to take calculated risks, is now more important than ever in the context of global economic transformations and the rapid advancement of technology. The new media environment, driven by big data, social media platforms, and Internet technologies, presents both challenges and valuable opportunities for universities seeking to cultivate entrepreneurial mindsets among their students [1]–[3]. This study explores the educational pathways that universities can adopt to strengthen innovation and entrepreneurship education from the perspective of new media, with particular emphasis on optimizing resource allocation and enhancing the overall effectiveness of educational practices.
The changing nature of entrepreneurship, influenced by the widespread presence of digital technologies, requires a comprehensive understanding of how educational resources can be allocated effectively to maximize students’ entrepreneurial potential. In this regard, the application of new media tools and technologies provides a valuable opportunity to create dynamic, interactive, flexible, and personalized learning experiences that can better equip students with the practical skills, knowledge, and mindset necessary for entrepreneurial success [4], [5]. The expanding role of big data analytics in entrepreneurship education also facilitates the design of tailored educational pathways that address the diverse learning needs and personal characteristics of students, ranging from the enhancement of creativity and opportunity-recognition abilities to the development of resilience and perseverance when confronting entrepreneurial challenges.
As the entrepreneurial landscape becomes increasingly complex and unpredictable, university students must be equipped not only with relevant theoretical knowledge but also with the practical skills, competencies, and entrepreneurial mindset required to navigate uncertainty successfully. The integration of innovation and entrepreneurship education into higher education is therefore critical for enabling students to thrive in an increasingly competitive, rapidly changing, and digitally driven economy [6], [7]. Moreover, these educational efforts are essential for addressing rising unemployment rates because innovation and entrepreneurship provide viable pathways through which students can create their own employment opportunities, contribute to narrowing the unemployment gap, generate new forms of economic activity, and stimulate sustainable economic growth.
New media technologies, including online learning platforms, social media networks, and big data systems, provide innovative opportunities to reconsider and improve traditional educational models. These technologies allow universities to expand the reach and accessibility of their educational offerings, engage students in real-time problem-solving activities, and facilitate meaningful cross-disciplinary collaboration. By effectively leveraging these tools, universities can foster an active learning environment in which students participate directly in entrepreneurial projects, collaborate with industry professionals and experts, and develop practical solutions to real-world problems [8]. Furthermore, the application of big data technologies and algorithmic models can help universities tailor their innovation and entrepreneurship programs to align more closely with changing industry requirements and individual student capabilities, thereby ensuring that available educational resources are allocated and utilized effectively to achieve the best possible learning outcomes.
This study seeks to investigate how new media technologies can be strategically integrated into higher education institutions to enhance the quality and effectiveness of innovation and entrepreneurship education. By constructing a linear spatial model of innovation and entrepreneurship capabilities, the study aims to identify and analyze the principal dimensions of entrepreneurial competence, including creativity, perseverance, and opportunity recognition, and to develop a multi-objective optimization model for the allocation of educational resources. The application of these analytical models provides empirical evidence regarding how the appropriate use of new media can improve the efficiency of educational resource distribution and utilization, ultimately fostering a more supportive, responsive, and conducive educational environment for entrepreneurial development and success.
The ultimate goal of this research is to identify practical educational pathways and effective strategies that can optimize the development of innovation and entrepreneurship capabilities among university students [9]. In doing so, the study contributes to the broader academic discourse concerning the role of new media in transforming higher education, improving educational resource allocation, and empowering students to become capable and successful entrepreneurs in an increasingly complex and technology-driven world. The findings of this research provide valuable insights into how higher education institutions can better prepare students to address the challenges and opportunities associated with the contemporary entrepreneurial ecosystem, while helping to bridge the persistent gap between university education, entrepreneurial practice, and the evolving needs of modern industries.
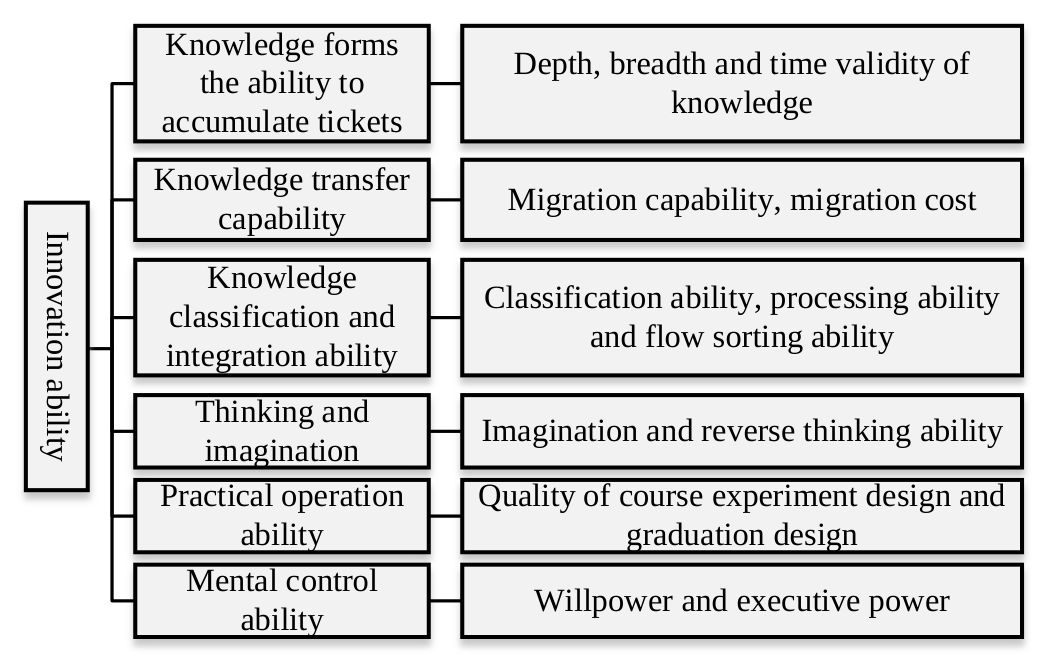
Innovation consciousness, innovative thinking, an innovative mentality, and the accumulation of relevant knowledge should all be regarded as essential components of innovation capacity. The fundamental elements of innovation ability can be summarized as knowledge acquisition and accumulation, knowledge transfer, knowledge classification and integration, thinking and imagination, practical application, and mental control, including executive ability and willpower [7]. Accordingly, innovation ability can be represented within the linear space \(\mathbb{R}^{6}\) by six dimensions: knowledge formation and accumulation, knowledge transfer ability, knowledge classification and integration management ability, thinking and imagination, practical operation ability, and mental control ability. Together, these elements constitute a six-dimensional linear vector space. Before the model is applied, it is necessary to examine whether each dimension is independent of the other dimensions and whether substantial correlations exist among the selected components [8].
As illustrated in Figure 1, a measurement scale can be designed for the fundamental components of innovation ability. Knowledge accumulation can be evaluated according to the depth, breadth, and temporal validity of the knowledge acquired by students. Knowledge transfer ability can be assessed in terms of transfer effectiveness, transfer efficiency, and transfer cost. The ability to classify, integrate, and manage knowledge can be measured through knowledge-classification ability, knowledge-management ability, and deductive-reasoning ability. Similarly, thinking and imagination can be evaluated through indicators such as imagination, creative thinking, and reverse-thinking ability. Practical operation ability can be assessed according to students’ performance in course-based practical activities, the quality of experimental designs, and the quality of graduation-project designs. Mental control ability can be evaluated by examining executive ability, self-regulation, perseverance, and willpower. To measure these six dimensions systematically, students can be asked to answer a specified number of multiple-choice questions corresponding to each area, after which the scores obtained in the individual dimensions can be calculated and analyzed.
To provide a more scientific and systematic explanation of the meaning and structure of entrepreneurial competencies, case studies and questionnaire surveys can be combined to identify their principal dimensions. On this basis, entrepreneurial competence can be represented through seven dimensions: relationship competence, innovative creativity, entrepreneurial perseverance, opportunity recognition and exploitation, entrepreneurial motivation, resource integration, and practical learning ability [10]. These seven dimensions collectively describe the abilities required to establish productive relationships, generate creative solutions, persist when facing difficulties, identify and seize market opportunities, maintain entrepreneurial motivation, integrate available resources, and continuously acquire relevant knowledge and practical skills.
As presented in Table 1, the individual components of entrepreneurial competence can be measured by designing a specified number of multiple-choice questions for every dimension. Students can be asked to answer these questions, and their scores for the seven dimensions can subsequently be calculated. The resulting scores can then be converted into relative probabilities or standardized weights to determine the relative contribution of each component to overall entrepreneurial competence. Finally, factor analysis can be employed to examine the correlations among the dimensions, evaluate whether the proposed component structure is statistically reasonable, and determine whether the selected indicators adequately represent the broader construct of entrepreneurial competence [11].
| Serial number | Element dimension | Connotation and evaluation focus |
|---|---|---|
| 1 | Relationship competence | The ability to establish and maintain productive relationships among individuals and between individuals and organizations |
| 2 | Innovative creativity | The ability to address different problems within an enterprise by developing and applying creative ideas and solutions |
| 3 | Entrepreneurial perseverance | The ability to persevere and avoid giving up despite the challenges, setbacks, uncertainties, and losses encountered during entrepreneurship |
| 4 | Opportunity recognition and exploitation | The ability to identify, evaluate, and seize market opportunities by applying a variety of appropriate methods and techniques |
| 5 | Entrepreneurial motivation | The expectations, aspirations, sustained efforts, and achievements associated with pursuing and maintaining an entrepreneurial career and lifestyle |
| 6 | Resource integration | The ability to identify, coordinate, and integrate internal and external human, financial, material, informational, and technological resources |
| 7 | Practical learning ability | The ability to continuously acquire, apply, and update new knowledge, information, experience, and skills related to business and entrepreneurial practice |
Assuming that the preceding hypothesis is valid, a set of basis vectors representing innovation ability can be defined in the six-dimensional linear space \(\mathbb{R}^{6}\). These basis vectors correspond to knowledge formation and accumulation, knowledge transfer ability, knowledge classification and integration management ability, thinking and imagination, practical operation ability, and mental control ability [12]. Each basis vector represents a fundamental and measurable component of an individual’s overall innovation capability. Similarly, \(T^{7}\) can be constructed as another set of basis vectors representing the seven dimensions of entrepreneurial competence: relationship competence, opportunity recognition and exploitation, innovation and creativity, resource integration, entrepreneurial motivation, entrepreneurial perseverance, and learning through practice. After these two sets of basis vectors have been constructed, their coefficients and the corresponding weights of the individual components of innovation and entrepreneurship ability can be determined [13].
The weights can be determined using the evaluation indicators associated with each component. Taking innovation capability as an example, suppose that there are \(m\) attributes for evaluating the innovation and entrepreneurship capabilities of all individuals. These attributes are denoted by \(C_1,C_2,\ldots,C_m\) and are used as the basis for determining the corresponding weights. A weight represents the degree to which a particular indicator influences an individual’s overall innovation and entrepreneurship capability. The magnitude of a weight is generally positively correlated with the degree of influence of the corresponding indicator. Each weight ranges from 0 to 1, and the sum of the weights assigned to all evaluation factors is equal to 1. Consequently, indicators that exert a stronger influence on the comprehensive evaluation receive relatively larger weights, whereas indicators with weaker effects receive relatively smaller weights.
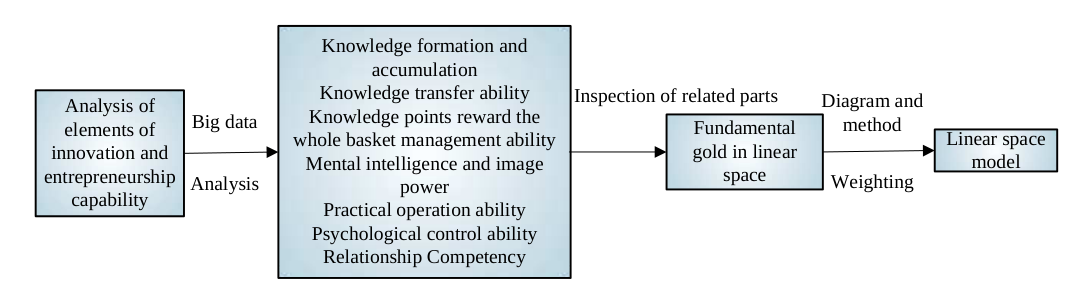
After the constituent elements of innovation and entrepreneurship ability have been determined, the correlations and independence among the fundamental components are examined. The similarities between the two sets of basis vectors are then evaluated, and correlation analysis is performed for the measurement indicators associated with each vector. On this basis, a unified set of basis vectors for the linear space of innovation and entrepreneurship ability can be constructed. The weight of each basis vector is subsequently determined using topological theory, thereby allowing the linear spatial model of innovation and entrepreneurship ability to be established.
As illustrated in Figure 2, the resulting capability vector can be expressed as
where \(\xi_i\) denotes the coordinate or weighted value associated with the \(i\)th basis vector, and \(n\) denotes the dimension of the constructed linear space. The restriction \(n\leq 11\) reflects the dimensional structure retained after examining the similarities, correlations, and independence of the original components. The spatial model therefore provides a unified representation of the principal components of innovation and entrepreneurship capability.
Because the linear space representing innovation capability is abstract and cannot be observed or quantified directly, its theoretical components must be transformed into observable and measurable indicators. Knowledge acquisition ability can be evaluated in terms of the depth and breadth of acquired knowledge and its temporal validity [14]. Knowledge transfer ability can be assessed according to the effectiveness and cost of transferring knowledge. The ability to classify, integrate, and manage knowledge can be evaluated through knowledge-classification ability, knowledge-management ability, and deductive-reasoning ability. Thinking and imagination can be observed through indicators such as imaginative ability, creative thinking, and reverse-thinking ability [15]. Practical operation ability can be calculated according to students’ performance in course-based practical work, experimental design, and graduation-project design. Mental control ability can be measured by observing an individual’s willpower, self-regulation, and executive ability [16].
The dimensions of entrepreneurial competence can also be transformed into observable measures. For example, relationship competence can be evaluated by examining an individual’s willingness and ability to maintain contact with new acquaintances and establish constructive relationships with unfamiliar people [17]. Opportunity-recognition and opportunity-exploitation abilities can be measured by assessing whether an individual can evaluate the feasibility of potential business opportunities and identify suitable methods for estimating the value of those opportunities [18]. The remaining dimensions can likewise be evaluated through appropriately designed indicators, questionnaire items, and statistical measurements [17].
Two principal tasks are required to complete this transformation. First, a mapping must be constructed between the basis vectors in the linear space and the corresponding observable measures. Second, an appropriate measurement scale must be developed for evaluating these observable indicators. After the required data have been collected, statistical calculations can be performed, and the evaluation model can be expressed as
where \(f_i\) denotes the mapping function that connects the \(i\)th abstract capability component with its corresponding observable measure \(\psi_i\). Through this mapping relationship, the abstract coordinates of the linear spatial model can be expressed in terms of measurable evaluation indicators.
Since the calculated vector
reflects the original vector defined in Eq. (1), its individual components represent the magnitudes of the basis-vector coordinates in the linear space used to describe innovation and entrepreneurship capability. The following procedure can therefore be used to conduct the evaluation.
Step 1: First, the linear spatial vector representing the innovation and entrepreneurship ability of a known successful individual is measured. The resulting vector is then adopted as the reference or standard value against which the capabilities of other individuals can be compared.
Step 2: Next, the difference or variance between each basis-vector component of a specific evaluated individual and the corresponding component of the standard reference vector is calculated. The grey relational coefficient used for this comparison is given in Eq. (4):
The calculated differences are used to identify the specific fundamental components of innovation and entrepreneurship ability that deviate substantially from the reference standard.
Step 3: Finally, targeted measures are implemented to strengthen the identified components of innovation and entrepreneurship capability. The required enhancement can be represented as
where \(\Delta_i\) denotes the improvement required for the \(i\)th component, and \(\Delta_0\) denotes the predetermined threshold. Components whose deviations exceed the specified threshold are prioritized for targeted educational intervention and capability development.
The grey correlation coefficient is calculated using the following formula:
Using Eq. (6), the correlation coefficient \(\xi_{iK}\) is calculated for each indicator, where \(i=1,2,\ldots,6\) and \(k=1,2,\ldots,11\).
| 64.55Evaluation index system of innovation and entrepreneurship education for college students |
First-level indicators | Secondary indicators | weight | A | B | C | D | E | F | G | H |
|---|---|---|---|---|---|---|---|---|---|---|---|
| Innovation and entrepreneurship courses and activities |
Number of innovation and entrepreneurship courses | 0.02 | 60.01 | 69.62 | 71.82 | 67.82 | 74.71 | 72.40 | 76.95 | 68.92 | |
| Innovation and entrepreneurship course content | 0.02 | 61.17 | 70.78 | 73.67 | 68.45 | 70.55 | 74.09 | 76.55 | 69.67 | ||
| Innovation and entrepreneurship lectures | 0.03 | 61.78 | 69.22 | 70.78 | 68.34 | 72.91 | 75.16 | 76.17 | 68.95 | ||
| Innovation and entrepreneurship activities | 0.05 | 64.13 | 70.02 | 72.35 | 68.77 | 74.71 | 76.23 | 75.54 | 70.05 | ||
| Innovation and entrepreneurship education conditions |
Teachers of innovation and entrepreneurship education | 0.02 | 67.02 | 72.68 | 76.35 | 71.88 | 76.49 | 76.21 | 77.32 | 73.07 | |
| Innovation and entrepreneurship education system | 0.03 | 61.72 | 72.68 | 76.55 | 72.87 | 76.44 | 75.69 | 76.93 | 72.75 | ||
| Innovation and entrepreneurship books | 0.02 | 68.83 | 72.68 | 76.67 | 70.45 | 76.49 | 75.69 | 76.93 | 72.45 | ||
| Construction of innovation and entrepreneurship sites and facilities |
0.02 | 66.48 | 71.56 | 68.72 | 69.82 | 75.89 | 75.12 | 78.09 | 72.42 | ||
| Innovation and entrepreneurship atmosphere | 0.02 | 64.72 | 72.33 | 73.18 | 69.35 | 74.72 | 75.16 | 76.56 | 72.32 | ||
| Innovation and entrepreneurship education channels |
Access to education information | 0.04 | 64.77 | 70.38 | 69.49 | 68.02 | 74.13 | 73.52 | 77.32 | 71.49 | |
| Convenience of access to education services | 0.05 | 64.12 | 70.39 | 70.02 | 68.45 | 75.96 | 75.65 | 76.19 | 70.95 | ||
| Feedback on demand channels for innovation and entrepreneurship education |
0.05 | 65.32 | 71.56 | 60.49 | 67.89 | 74.72 | 75.69 | 75.78 | 70.45 | ||
| Individual innovation and entrepreneurship | Development of innovation and entrepreneurship awareness | 0.15 | 60.01 | 65.38 | 67.62 | 67.08 | 75.56 | 71.36 | 73.85 | 65.49 | |
| Evaluation of mastery of innovation and entrepreneurship knowledge |
0.08 | 53.54 | 60.02 | 58.42 | 60.14 | 66.25 | 68.14 | 68.07 | 62.65 | ||
| Evaluation of innovation and entrepreneurship ability | 0.12 | 64.13 | 71.95 | 72.12 | 69.12 | 77.08 | 73.52 | 73.07 | 62.65 | ||
| Evaluation of preferences for innovation and entrepreneurship | 0.16 | 65.89 | 65.16 | 64.49 | 68.41 | 76.49 | 72.47 | 68.02 | 63.52 | ||
| Evaluation of individual innovation and entrepreneurship achievements | 0.10 | 53.54 | 60.02 | 58.45 | 60.12 | 68.25 | 76.45 | 72.41 | 74.22 | ||
| Achievements of innovation and entrepreneurship education in colleges and universities |
Theoretical innovation of innovation and entrepreneurship education in colleges and universities |
0.04 | 64.12 | 71.93 | 72.12 | 69.11 | 77.05 | 73.32 | 75.02 | 62.45 | |
| Practical innovation in college and university innovation and entrepreneurship education |
0.02 | 66.49 | 71.55 | 71.59 | 69.22 | 78.25 | 74.61 | 75.02 | 71.49 | ||
| Innovation and entrepreneurship education and management innovation in colleges and universities |
0.04 | 64.72 | 74.25 | 71.51 | 69.12 | 77.05 | 74.02 | 76.94 | 71.59 | ||
| Achievements of innovation and entrepreneurship education in colleges and universities |
0.05 | 68.272.455 | 72.35 | 73.41 | 69.82 | 76.45 | 76.49 | 76.44 | 72.22 |
Each calculated coefficient represents the degree of correlation between an individual comparison indicator and the corresponding indicator in the reference sequence. The complete set of correlation coefficients is subsequently organized into the grey correlation coefficient matrix \(\boldsymbol{\Xi}=(\xi_{iK})\).
Based on the components presented in Table 1, the weights of the different indicators at each hierarchical level can be represented by \(W_{AB}\), \(W_{B1C}\), \(W_{B2C}\), \(W_{B3C}\), \(W_{B4C}\), and \(W_{B5C}\). The general correlation vector is expressed as
where \(r_i\) represents the calculated correlation degree of the \(i\)th indicator. Using Eq. (7), the correlation degrees of the indicators at the different hierarchical levels are calculated. The resulting correlation vectors are given in Eq. (8).
In Eq. (8), \(E_{B1C}\), \(E_{B2C}\), \(E_{B3C}\), \(E_{B4C}\), and \(E_{B5C}\) are the matrices composed of the corresponding data obtained from the grey correlation coefficient table. Each matrix contains the correlation coefficient values associated with the indicators belonging to its respective criterion layer. Multiplication by the corresponding weight vector produces the weighted correlation vector for each criterion group.
The final correlation vector between the target layer and the evaluation indicators is calculated by combining the five criterion-level correlation vectors. The resulting comprehensive correlation vector \(R_A\) is calculated using Eq. (9):
Eq. (9) gives the comprehensive grey correlation degree for each of the eight evaluated institutions. A larger correlation value indicates that the corresponding institution is more closely associated with the reference sequence and therefore demonstrates a higher overall quality of innovation and entrepreneurship education. Based on the magnitudes of the correlation coefficients contained in \(R_A\), the quality of innovation and entrepreneurship education in the eight institutions can be ranked in the following descending order:
As shown in Eq. (10), institution \(E\) achieves the highest comprehensive correlation degree, followed by institutions \(G\), \(F\), and \(H\). In contrast, institution \(A\) has the lowest comprehensive correlation degree among the eight evaluated institutions.
Among the eight colleges and universities examined, Institution E has the highest degree of correlation with the ideal reference institution, with a correlation value of 0.3177. Institution E therefore demonstrates the strongest overall performance in innovation and entrepreneurship education among the evaluated institutions.
| Zone | Region | Regional innovation level | Regional entrepreneurship level | ||||||
|---|---|---|---|---|---|---|---|---|---|
| 2006 | 2010 | 2014 | 2018 | 2006 | 2010 | 2014 | 2018 | ||
| Eastern region | Beijing | 0.1638 | 0.2577 | 0.4166 | 0.5726 | 0.0936 | 0.1205 | 0.2974 | 0.5324 |
| Tianjin | 0.0456 | 0.0552 | 0.0902 | 0.1297 | 0.0314 | 0.037 | 0.0788 | 0.1805 | |
| Hebei | 0.0378 | 0.0506 | 0.074 | 0.1095 | 0.0287 | 0.0274 | 0.0445 | 0.1532 | |
| Liaoning | 0.0574 | 0.0806 | 0.0974 | 0.1185 | 0.0406 | 0.0469 | 0.0521 | 0.0897 | |
| Shanghai | 0.0885 | 0.1335 | 0.1674 | 0.2685 | 0.0702 | 0.1112 | 0.1865 | 0.414 | |
| Jiangsu | 0.1128 | 0.2488 | 0.3567 | 0.4877 | 0.0882 | 0.128 | 0.1649 | 0.3185 | |
| Zhejiang | 0.0935 | 0.1855 | 0.2697 | 0.26 | 0.0489 | 0.1026 | 0.0871 | 0.2287 | |
| Fujian | 0.034 | 0.0526 | 0.0838 | 0.1497 | 0.0405 | 0.049 | 0.057 | 0.1045 | |
| Shandong | 0.0722 | 0.128 | 0.1926 | 0.28 | 0.0487 | 0.1024 | 000874 | 0.2289 | |
| Guangdong | 0.1482 | 0.2612 | 0.3637 | 0.6398 | 0.1145 | 0.1648 | 0.2435 | 0.578 | |
| Hainan | 0.0187 | 0.0328 | 0.0297 | 0.0196 | 0.0138 | 0.0132 | 0.0147 | 0.0278 | |
| Mean value | 0.0796 | 0.1352 | 0.1947 | 0.2865 | 0.0572 | 0.0789 | 0.1214 | 0.2598 | |
| Central region | Shanxi | 0.0365 | 0.0367 | 0.0442 | 0.0512 | 0.0245 | 0.0244 | 0.0207 | 0.0302 |
| Jilin | 0.0378 | 0.0445 | 0.0507 | 0.0689 | 0.0205 | 0.0226 | 0.0202 | 0.0306 | |
| Heilongjiang | 0.0421 | 0.0569 | 0.0601 | 0.0668 | 0.023 | 0.03 | 0.0228 | 0.0915 | |
| Anhui | 0.0349 | 0.0557 | 0.0986 | 0.1496 | 0.028 | 0.0246 | 0.0335 | 0.088 | |
| Jiangxi | 0.0281 | 0.0377 | 0.0487 | 0.0933 | 0.0239 | 0.0236 | 0.0285 | 0.0529 | |
| Henan | 0.0448 | 0.0635 | 0.098 | 0.1398 | 0.0248 | 0.0279 | 0.0485 | 0.1518 | |
| Hubei | 0.0596 | 0.0828 | 0.1294 | 0.2165 | 0.0268 | 0.0338 | 0.0686 | 0.1935 | |
| Hunan | 0.0418 | 0.0625 | 0.0877 | 0.1214 | 0.0 | 258 | 0.0223 | 0.0299 | |
| Mean value | 0.0407 | 0.0549 | 0.0772 | 0.1147 | 0.0249 | 0.0252 | 0.0342 | 0.0908 | |
| Western region | Inner Mongolia | 0.0187 | 0.0237 | 0.0295 | 0.0304 | 0.0172 | 0.0155 | 0.0174 | 0.0253 |
| Guangxi | 0.0265 | 0.0339 | 0.0454 | 0.054 | 0.0198 | 0.0166 | 0.0238 | 0.0572 | |
| Chongqing | 0.0247 | 0.0386 | 0.0582 | 0.0936 | 0.0248 | 0.0312 | 0.0496 | 0.01602 | |
| Sichuan | 0.0545 | 0.785 | 0.1128 | 0.2047 | 0.0249 | 0.0316 | 0.0495 | 0.1600 | |
| Guizhou | 0.0212 | 0.0244 | 0.0306 | 0.0478 | 0.0162 | 0.0135 | 0.0216 | 0.0346 | |
| Yunnan | 0.0336 | 0.0336 | 0.0426 | 0.0541 | 0.015 | 0.0163 | 0.0238 | 0.0385 | |
| Tibet | 0.0087 | 0.0144 | 0.0423 | 0.0102 | 0.0135 | 0.0139 | 0.0055 | 0.0093 | |
| Shaanxi | 0.0596 | 0.0698 | 0.1175 | 0.1779 | 0.0205 | 0.0338 | 0.0306 | 0.0879 | |
| Gansu | 0.0384 | 0.032 | 0.0356 | 0.0412 | 0.0156 | 0.0129 | 0.0145 | 0.0198 | |
| Qinghai | 0.0268 | 0.0188 | 0.0217 | 0.0166 | 0.015 | 0.0096 | 0.0084 | 0.0112 | |
| Ningxia | 0.0158 | 0.0063 | 0.0205 | 0.0177 | 0.0169 | 0.0113 | 0.0127 | 0.0223 | |
| Xinjiang | 0.0296 | 0.0178 | 0.0258 | 0.0296 | 0.0154 | 0.0126 | 0.0128 | 0.0225 | |
| Mean value | 0.0502 | 0.0326 | 0.0487 | 0.0649 | 0.0183 | 0.0177 | 0.0212 | 0.0479 | |
| Mean value | 0.0268 | 0.0748 | 0.1078 | 0.1563 | 0.0338 | 0.0415 | 0.0598 | 0.1341 | |
The second level is represented by Institutions G, F, and H, with correlation degrees of 0.2411, 0.1408, and 0.0411, respectively. These four institutions have higher correlation degrees than the remaining four institutions: Institution D, with a correlation degree of 0.0397; Institution B, with a correlation degree of 0.0389; Institution C, with a correlation degree of 0.0388; and Institution A, with a correlation degree of 0.0262. These four institutions are therefore classified within the third performance level. The detailed indicators, weights, and institutional evaluation scores supporting this comparison are presented in Table 2.
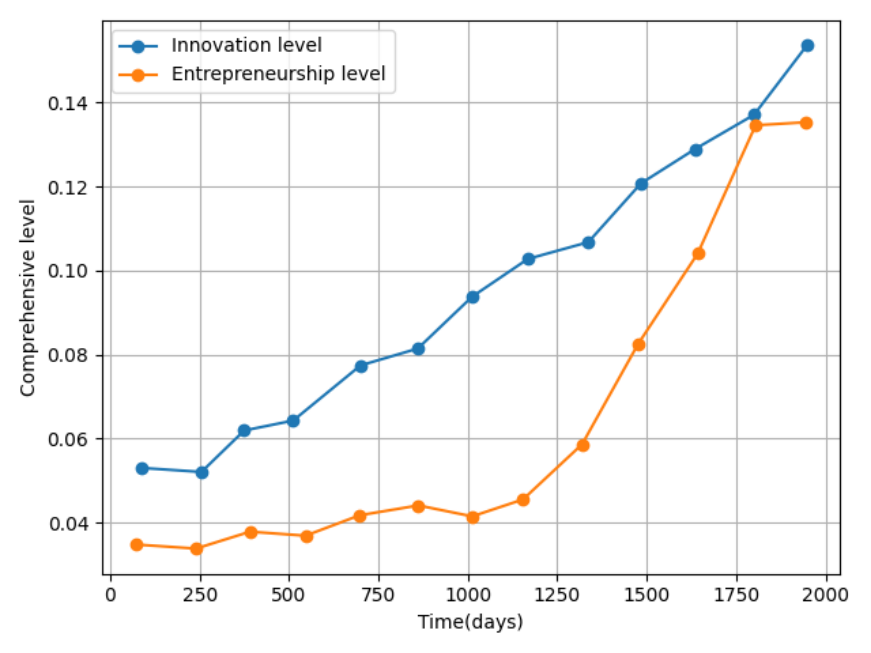
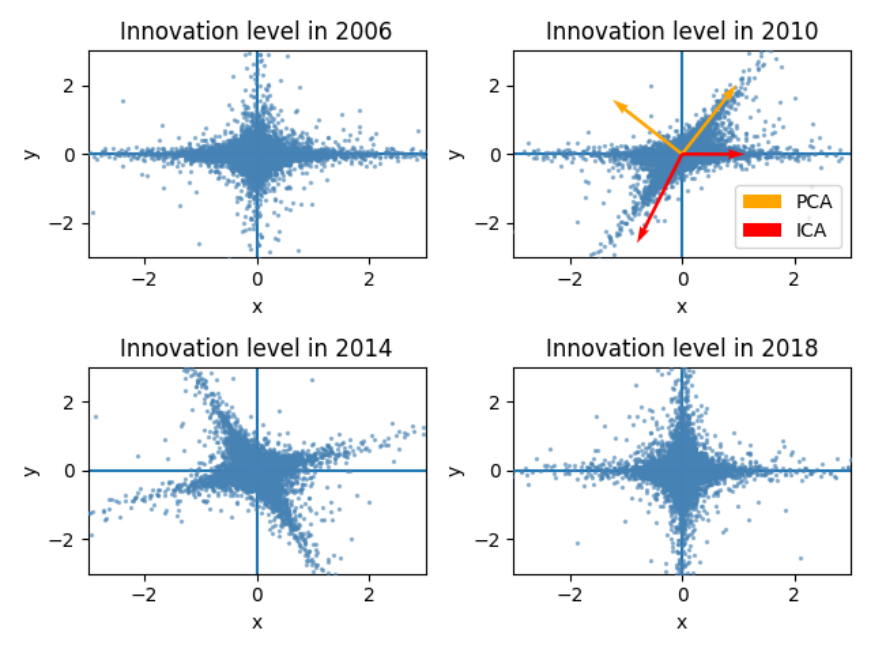
The results of the comprehensive assessment of innovation and entrepreneurship levels in each province, conducted using the TOPSIS model based on the entropy-weight method, are presented in Table 3 and illustrated in Figures 3 and 4. Figure 3 reveals two principal temporal characteristics. First, from 2006 to 2018, the national average levels of innovation and entrepreneurship displayed generally increasing trends, and the two time series exhibited a clear positive association. Second, the national regional innovation level followed an approximately linear upward trend, whereas the regional entrepreneurship level demonstrated an evident three-stage pattern. The level of entrepreneurship development increased slowly from 2006 to 2013, increased rapidly from 2014 to 2017, and then exhibited slower growth from 2017 to 2018 [17], [18]. In recent years, China’s innovation performance and efficiency, the number and competitiveness of innovation clusters, the number and scale of entrepreneurial enterprises, and the overall performance and competitiveness of entrepreneurship have all occupied prominent positions in the international environment [19].
Table 3 and Figure 4 show substantial regional variation in China’s levels of innovation and entrepreneurship, with economically developed regions generally exhibiting higher levels of both. Across the three major zones, the levels of innovation and entrepreneurship in the eastern, central, and western regions increased during the study period. From a chronological and regional perspective, the eastern region maintained the highest average levels of innovation and entrepreneurship, remaining above the national average. It was followed by the central and western regions, both of which remained below the national average. At the provincial level, Beijing, Guangdong, and Jiangsu recorded the highest innovation levels in 2006, whereas Hainan, Xinjiang, and Tibet recorded the lowest. By 2018, Guangdong, Beijing, and Jiangsu had the highest innovation levels, while Hainan, Qinghai, and Tibet had the lowest levels [20]. Similarly, Guangdong, Beijing, and Jiangsu recorded the highest entrepreneurship levels in 2006, whereas Gansu, Hainan, and Tibet recorded the lowest. In 2018, Guangdong, Beijing, and Shanghai had the highest entrepreneurship levels, while Ningxia, Qinghai, and Tibet had the lowest levels [21]. Overall, innovation and entrepreneurship were concentrated mainly in developed areas, including the Beijing–Tianjin–Hebei region, the Yangtze River Delta, and the Pearl River Delta, whereas many less-developed western regions remained at comparatively low levels. Because of China’s extensive territory and considerable disparities in regional economic development, innovation and entrepreneurship levels differ substantially among regions. These differences may further intensify disparities in regional economic development and produce a Matthew effect in the spatial distribution of innovation and entrepreneurship resources and outcomes [22].
The regional degrees of coordination between innovation and entrepreneurship were determined using the coupling-coordination evaluation method. The complete results are reported in Table 4, while their geographical pattern is illustrated in Figure 5. Although clear differences exist among individual locations, the results indicate that the coordination of innovation and entrepreneurship generally increased across the country’s provinces and regions during the study period. From the perspective of coupling coordination and comparative ranking, the provinces display a pronounced east–west divide. Between 2006 and 2018, Beijing, Shanghai, Jiangsu, Zhejiang, and Guangdong generally maintained relatively high levels and rankings, whereas Tibet, Qinghai, and Ningxia remained at comparatively low levels. Thus, the spatial distribution of coupling coordination exhibits an overall pattern of “high values in the east and low values in the west.” From the perspective of the reported growth rates, Hubei and Sichuan experienced the fastest growth from 2006 to 2018. They were followed by Guangdong, Beijing, Henan, Zhejiang, Shanghai, Shandong, Tianjin, Jiangsu, Hebei, Chongqing, Anhui, Shanxi, and Fujian, whose growth rates were reported to be higher than the national average. In contrast, several western regions, including Qinghai, Ningxia, and Tibet, experienced relatively weak or negative changes in coupling coordination over the same period [23].
In the context of “mass innovation and mass entrepreneurship,” innovation and entrepreneurship have developed rapidly across China’s provinces and regions. High levels of development are concentrated in areas characterized by comparatively strong economies and high levels of urbanization, including Beijing as the core city of the Beijing–Tianjin–Hebei region; Shanghai, Jiangsu, and Zhejiang in the Yangtze River Delta; Guangdong in the Pearl River Delta; Hubei in the middle reaches of the Yangtze River; and Sichuan. These locations also contain a substantial concentration of regions in which innovation and entrepreneurship demonstrate relatively strong coupling and coordination [24].
| Zone | Region | 2006 | Stage | 2010 | Stage | 2014 | Stage | 2018 | Stage | Growth rate |
|---|---|---|---|---|---|---|---|---|---|---|
| Eastern region | Beijing | 0.3523 | \(\mathrm{IV}\) | 0.4195 | \(\mathrm{III}\) | 0.5932 | \(\mathrm{III}\) | 0.7433 | \(\mathrm{II}\) | 0.0926 |
| Tianjin | 0.1946 | \(\mathrm{V}\) | 0.2114 | \(\mathrm{IV}\) | 0.2902 | \(\mathrm{IV}\) | 0.3914 | \(\mathrm{IV}\) | 0.0846 | |
| Hebei | 0.1820 | \(\mathrm{V}\) | 0.1936 | \(\mathrm{V}\) | 0.2381 | \(\mathrm{IV}\) | 0.3598 | \(\mathrm{IV}\) | 0.0812 | |
| Liaoning | 0.2199 | \(\mathrm{IV}\) | 0.2472 | \(\mathrm{IV}\) | 0.2672 | \(\mathrm{IV}\) | 0.3216 | \(\mathrm{IV}\) | 0.0386 | |
| Shanghai | 0.2814 | \(\mathrm{IV}\) | 0.3496 | \(\mathrm{IV}\) | 0.4204 | \(\mathrm{III}\) | 0.5766 | \(\mathrm{III}\) | 0.0877 | |
| Jiangsu | 0.3162 | \(\mathrm{IV}\) | 0.4231 | \(\mathrm{III}\) | 0.4923 | \(\mathrm{III}\) | 0.5515 | \(\mathrm{II}\) | 0.0825 | |
| Zhejiang | 0.2689 | \(\mathrm{IV}\) | 0.2241 | \(\mathrm{IV}\) | 0.4102 | \(\mathrm{III}\) | 0.3532 | \(\mathrm{III}\) | 0.0878 | |
| Fujian | 0.1912 | \(\mathrm{V}\) | 0.1449 | \(\mathrm{IV}\) | 0.2653 | \(\mathrm{IV}\) | 0.4985 | \(\mathrm{IV}\) | 0.0705 | |
| Shandong | 0.2437 | \(\mathrm{IV}\) | 0.3042 | \(\mathrm{IV}\) | 0.3600 | \(\mathrm{IV}\) | 0.7765 | \(\mathrm{III}\) | 0.0874 | |
| Guangdong | 0.3608 | \(\mathrm{IV}\) | 0.1726 | \(\mathrm{III}\) | 0.5452 | \(\mathrm{III}\) | 0.1518 | \(\mathrm{II}\) | 0.0962 | |
| Hainan | 0.1268 | \(\mathrm{V}\) | 0.1781 | \(\mathrm{V}\) | 0.1445 | \(\mathrm{V}\) | 0.4869 | \(\mathrm{V}\) | 0.0166 | |
| Mean value | 0.2489 | \(\mathrm{IV}\) | 0.1835 | \(\mathrm{IV}\) | 0.3662 | \(\mathrm{IV}\) | 0.2281 | \(\mathrm{III}\) | 0.0752 | |
| Central region | Shanxi | 0.1722 | \(\mathrm{V}\) | 0.1922 | \(\mathrm{V}\) | 0.1736 | \(\mathrm{V}\) | 0.2142 | \(\mathrm{IV}\) | 0.0274 |
| Jilin | 0.1674 | \(\mathrm{V}\) | 0.1725 | \(\mathrm{V}\) | 0.1798 | \(\mathrm{V}\) | 0.2798 | \(\mathrm{IV}\) | 0.0236 | |
| Heilongjiang | 0.1746 | \(\mathrm{V}\) | 0.2047 | \(\mathrm{V}\) | 0.1921 | \(\mathrm{V}\) | 0.3366 | \(\mathrm{IV}\) | 0.0502 | |
| Anhui | 0.1608 | \(\mathrm{V}\) | 0.2302 | \(\mathrm{V}\) | 0.2402 | \(\mathrm{IV}\) | 0.2648 | \(\mathrm{IV}\) | 0.0741 | |
| Jiangxi | 0.1825 | \(\mathrm{V}\) | 0.1928 | \(\mathrm{V}\) | 0.1932 | \(\mathrm{V}\) | 0.3815 | 0.0539 | ||
| Henan | 0.2000 | \(\mathrm{V}\) | 0.1908 | \(\mathrm{IV}\) | 0.2614 | \(\mathrm{IV}\) | 0.4522 | \(\mathrm{IV}\) | 0.0906 | |
| Hubei | 0.1816 | \(\mathrm{IV}\) | 0.2304 | \(\mathrm{IV}\) | 0.3069 | \(\mathrm{IV}\) | 0.3078 | \(\mathrm{III}\) | 0.1052 | |
| Hunan | 0.1772 | \(\mathrm{V}\) | 0.1926 | \(\mathrm{V}\) | 0.2258 | \(\mathrm{IV}\) | 0.3082 | \(\mathrm{IV}\) | 0.0907 | |
| Mean value | 0.1336 | \(\mathrm{V}\) | 0.1912 | \(\mathrm{V}\) | 0.2214 | \(\mathrm{IV}\) | 0.3085 | \(\mathrm{IV}\) | 0.0582 | |
| Western region | Inner Mongolia | 0.1332 | \(\mathrm{V}\) | 0.1378 | \(\mathrm{V}\) | 0.1496 | \(\mathrm{V}\) | 0.1672 | \(\mathrm{V}\) | 0.0208 |
| Guangxi | 0.1512 | \(\mathrm{V}\) | 0.1539 | \(\mathrm{V}\) | 0.1812 | \(\mathrm{V}\) | 0.2349 | \(\mathrm{V}\) | 0.0462 | |
| Chongqing | 0.1585 | \(\mathrm{V}\) | 0.1802 | \(\mathrm{V}\) | 0.2086 | \(\mathrm{IV}\) | 0.3062 | \(\mathrm{IV}\) | 0.0778 | |
| Sichuan | 0.1911 | \(\mathrm{V}\) | 0.2228 | \(\mathrm{IV}\) | 0.2733 | \(\mathrm{IV}\) | 0.4255 | \(\mathrm{III}\) | 0.1023 | |
| Guizhou | 0.1359 | \(\mathrm{V}\) | 0.1356 | \(\mathrm{V}\) | 0.1612 | \(\mathrm{V}\) | 0.2014 | \(\mathrm{IV}\) | 0.0401 | |
| Yunnan | 0.1523 | \(\mathrm{V}\) | 0.1524 | \(\mathrm{V}\) | 0.1778 | \(\mathrm{V}\) | 0.2136 | \(\mathrm{IV}\) | 0.0337 | |
| Tibet | 0.1039 | \(\mathrm{V}\) | 0.1185 | \(\mathrm{V}\) | 0.1225 | \(\mathrm{V}\) | 0.0982 | \(\mathrm{V}\) | -0.0215 | |
| Shaanxi | 0.1877 | \(\mathrm{V}\) | 0.2201 | \(\mathrm{IV}\) | 0.2455 | \(\mathrm{IV}\) | 0.3536 | \(\mathrm{IV}\) | -0.0108 | |
| Gansu | 0.1425 | \(\mathrm{V}\) | 0.1412 | \(\mathrm{V}\) | 0.1502 | \(\mathrm{V}\) | 0.1698 | \(\mathrm{V}\) | 0.0736 | |
| Qinghai | 0.1572 | \(\mathrm{V}\) | 0.1154 | \(\mathrm{V}\) | 0.1163 | \(\mathrm{V}\) | 0.1163 | \(\mathrm{V}\) | 0.0159 | |
| Ningxia | 0.452 | \(\mathrm{V}\) | 0.0910 | \(\mathrm{V}\) | 0.1277 | \(\mathrm{V}\) | 0.1165 | \(\mathrm{V}\) | -0.0215 | |
| Xinjiang | 0.1258 | \(\mathrm{V}\) | 0.1218 | \(\mathrm{V}\) | 0.1349 | \(\mathrm{V}\) | 0.1264 | \(\mathrm{V}\) | -0.0108 | |
| Mean value | 0.1488 | \(\mathrm{V}\) | 0.1493 | \(\mathrm{V}\) | 0.1706 | \(\mathrm{V}\) | 0.2144 | \(\mathrm{IV}\) | 0.0225 | |
| Mean value | 0.1915 | \(\mathrm{V}\) | 0.2148 | \(\mathrm{IV}\) | 0.2533 | \(\mathrm{IV}\) | 0.3356 | \(\mathrm{IV}\) | 0.0328 |
Higher levels of economic development are generally associated with more abundant and higher-quality innovation and entrepreneurship resources, stronger infrastructure, and a more favorable business environment. Together, these conditions promote the interconnected and coordinated development of regional innovation and entrepreneurship [25], [26].
Spatial autocorrelation analysis was conducted to describe more accurately the spatial characteristics of the coupling coordination between innovation and entrepreneurship across the provinces. First, the spatial autocorrelation of innovation–entrepreneurship coupling coordination throughout the entire study area was examined using the global Moran’s \(I\) statistic. The results of this analysis are shown in Figure 6. Subsequently, the local spatial correlation characteristics of coupling coordination were examined using the local Moran’s \(I\) statistic, and the corresponding cluster types are presented in Table 5. Figure 6 and Table 5 indicate substantial spatial autocorrelation in the coordination of innovation and entrepreneurship among the 31 Chinese provinces and provincial-level regions included in the analysis. From 2006 to 2018, the global Moran’s \(I\) index followed a generally increasing, although variable, trend. The statistic passed the 1% significance-level test in every reported year except 2006. These results indicate that regional innovation and entrepreneurship in China exhibit an increasingly evident pattern of spatial dependence rather than a random spatial distribution.
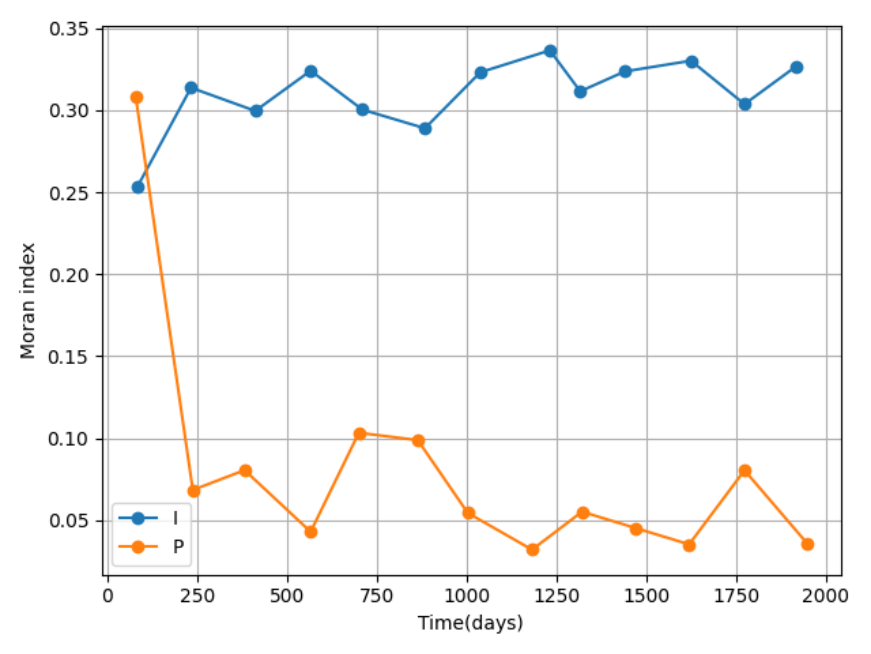
Table 5 presents the local Moran’s \(I\) clustering results. The high–high agglomeration areas are concentrated primarily in economically developed coastal regions, whereas the low–low agglomeration areas are concentrated mainly in less-developed northwestern regions. Sichuan entered the high–low agglomeration category in 2018, indicating that Sichuan had a comparatively high level of coordinated innovation and entrepreneurship development while its surrounding regions exhibited lower levels of coupling coordination. In 2006, Hebei, Anhui, and Fujian were classified within the low–high agglomeration category; by 2018, Jiangxi was included in this category. Between 2006 and 2018, the high–high agglomeration area expanded substantially and formed a more contiguous area of strong innovation and entrepreneurship coupling in the eastern and central regions. When this expansion is considered together with the local clustering results, it suggests that spatial spillover effects may have helped peripheral areas near the high–high clusters improve their coupling coordination and gradually become more closely connected to the core agglomeration area. The low–low agglomeration category was concentrated primarily in western locations, including Qinghai and Xinjiang, where innovation and entrepreneurship development also remained comparatively weak.
| Cluster type | 2006 | 2018 |
|---|---|---|
| H-H | Beijing, Tianjin, Shandong, Jiangsu, Shanghai, Zhejiang |
Beijing, Tianjin, Hebei, Shandong, Jiangsu, Shanghai, Zhejiang, Fujian, Anhui, Henan, Hunan |
| H-L | None | Sichuan |
| L-H | Hebei, Anhui, Fujian | Jiangxi |
| L-L | Sichuan, Qinghai, Xinjiang | Sichuan, Qinghai, Xinjiang |
| Not significant | Other regions | Other regions |
As shown in Table 5, the local Moran’s \(I\) results for Guangdong Province were not statistically significant during the reported period, despite Guangdong’s high overall level of innovation and entrepreneurship. One possible explanation is that the province’s strongest innovation and entrepreneurship activity is concentrated mainly in the Pearl River Delta, while surrounding areas display varying levels of coupling coordination. This internal spatial variation may weaken the evidence of significant local spatial autocorrelation when Guangdong is evaluated at the broader provincial level.
Optimal Solution 1 was selected as an illustrative example for analyzing the experimental data and determining whether the proposed model improves resource utilization efficiency. The resource utilization efficiency of each evaluated unit was calculated before the experiment and after optimization in accordance with Eq. (8). The complete results are presented in Table 6. In particular, C1, C3, C8, and C11 initially exhibited relatively low levels of resource utilization efficiency. Following optimization, their efficiency values increased from 0.705, 0.747, 0.798, and 0.694 to 1.057, 1.085, 1.045, and 1.073, respectively. These changes correspond to improvement rates of 49.7%, 44.9%, 30.8%, and 54.3%, respectively. The comparison in Table 6 therefore shows that the largest relative improvements occurred among several units with comparatively low initial efficiency values.
| Evaluation unit | Resource utilization efficiency | ||
|---|---|---|---|
| Before experiment |
After optimization |
Improvement rate |
|
| C1 | 0.705 | 1.057 | 0.497 |
| C2 | 0.994 | 1.028 | 0.033 |
| C3 | 0.747 | 1.085 | 0.449 |
| C4 | 0.970 | 1.063 | 0.094 |
| C5 | 1.019 | 1.057 | 0.037 |
| C6 | 0.871 | 1.027 | 0.178 |
| C7 | 1.009 | 1.036 | 0.026 |
| C8 | 0.798 | 1.045 | 0.308 |
| C9 | 0.936 | 1.031 | 0.101 |
| C10 | 1.027 | 1.046 | 0.018 |
| C11 | 0.694 | 1.073 | 0.543 |
| C12 | 0.856 | 1.066 | 0.244 |
This study demonstrates that the appropriate application of new media technologies can significantly enhance innovation and entrepreneurship education in higher education institutions. By optimizing the allocation of educational resources through a multi-objective optimization model, the study achieved improvements of 18.72% in resource utilization efficiency and 20.98% in resource allocation efficiency. The improvements in resource utilization across the evaluated units are presented in Table 6. These results indicate that the proposed model can support a more efficient, systematic, and targeted distribution of educational resources.
The integration of digital tools, big data analytics, online platforms, and social media technologies promotes personalized learning, real-time collaboration, interdisciplinary communication, and practical student engagement. These approaches can also help universities align their innovation and entrepreneurship programs more closely with changing industry requirements and students’ individual capabilities. Moreover, the regional findings illustrated in Figure 4 demonstrate that innovation and entrepreneurship development remains uneven across different regions, emphasizing the need for context-sensitive educational policies and resource-allocation strategies.
By providing students with flexible learning environments, practical entrepreneurial opportunities, and data-informed educational support, new media technologies can better prepare them to address entrepreneurial uncertainty and emerging market challenges. Such technologies can also strengthen students’ creativity, opportunity-recognition abilities, perseverance, resource-integration capacity, and entrepreneurial mindset within an increasingly complex and digitally driven economy.
The findings provide valuable theoretical and practical insights for universities seeking to improve the quality and effectiveness of entrepreneurship education. Higher education institutions should therefore strengthen digital infrastructure, expand cooperation with industry, develop personalized learning pathways, and apply data-driven evaluation methods when allocating educational resources. Future research should examine the long-term effects of these strategies across larger and more diverse institutional samples and evaluate how emerging technologies can further improve innovation and entrepreneurship education.
All data supporting the findings of this study are included within the article. Additional information may be obtained from the corresponding author upon reasonable request.
The authors received no specific funding for this research.
The authors declare that they have no conflicts of interest regarding the research, authorship, or publication of this article.
Xianxian Yang and Jiangtao Li contributed to the conception and design of the study, development of the methodology, analysis and interpretation of the results, and preparation of the manuscript. Both authors critically reviewed the manuscript, approved its final version, and accept responsibility for the integrity and accuracy of the work.
During the preparation of this manuscript, the authors used ChatGPT to improve the language, clarity, and readability of the text. Following the use of this tool, the authors carefully reviewed and revised the manuscript to ensure its accuracy, integrity, and scientific rigor. The authors take full responsibility for the final content of the manuscript.