
Knowledge sharing becomes an organizational resource when employees can use one another’s expertise in decisions and coordinated work. Its value therefore depends on what is shared, how it is interpreted, and which outcome is being considered. A conversation that resolves a production difficulty may improve immediate coordination without generating a new product. Conversely, a product-development insight may contribute to learning before any change in delivery or cost becomes visible. The knowledge-based account of the firm locates productive advantage in the integration of specialized knowledge rather than in information possession alone [1]. This distinction makes the relationship between knowledge sharing and performance an empirical question about particular organizational activities, rather than an automatic consequence of communication.
Research has repeatedly connected knowledge sharing with innovation and firm performance. Wang and Wang [2] distinguish aspects of sharing and innovation that need not contribute to performance in identical ways. A subsequent comparison of predictive models also treats the route from knowledge sharing to performance as something to evaluate, rather than assume [3]. More recent work examines the contribution of leadership support and knowledge-management success to peer sharing [4]. Research on top-management knowledge values and open innovation similarly embeds sharing within a wider set of organizational relationships [5]. Together, these studies justify examining knowledge sharing alongside innovation, but they do not establish that every performance dimension should have the same conditional association with sharing.
Pharmaceutical organizations offer a consequential setting for this distinction because their employees must coordinate specialized knowledge across activities. However, a pharmaceutical setting should not be treated as evidence that a survey directly measures drug discovery, manufacturing quality, or patient outcomes. The available measures concern employees’ assessments of organizational constructs. Research on Pakistani pharmaceutical manufacturing enterprises connects intellectual capital with innovation [6], while work on the global pharmaceutical industry examines cultural diversity in relation to innovative capacity [7]. These contributions support attention to knowledge and collaboration in this industry. They do not license replacing perceptual organizational outcomes with clinical effectiveness or inferring national industrial performance from a geographically restricted employee sample.
The distinction between performance outcomes also matters theoretically. Operational performance concerns the execution of organizational work, whereas a broader non-financial construct can combine customer, learning, and internal-process perspectives. These domains are related but are not interchangeable. A scoping review of innovation types and performance distinguishes financial from non-financial outcomes and highlights the need to retain the nature of the outcome under discussion [8]. Work on sustainability innovation also treats non-financial outcomes separately from economic performance [9]. Research distinguishing radical and incremental innovations further indicates why an aggregate innovation label cannot identify which activity underlies an association [10]. The present analysis consequently retains two performance outcomes without treating their names as direct observations of particular business processes.
Trust adds another interpretive difficulty. Employees who perceive their colleagues as trustworthy may also report more sharing and innovation. A positive correlation between trust and performance can therefore represent several overlapping relationships. Evidence from Poland examines trust, knowledge sharing, and innovative work behavior [11]. Laboratory research asks whether sharing can itself help build trust within incentive arrangements [12]. A broader review places trust within social relationships and emphasizes its contextual character [13]. These different directions of explanation make trust a relevant companion variable, but they also caution against assigning it a unique causal position from contemporaneous correlations. Its marginal association, conditional coefficient, and contribution to explained variance must be distinguished.
Much of the substantive literature articulates sequential relationships. Knowledge-oriented leadership, knowledge-management capacity, innovation, and performance have been examined through serial mediation [14]. Innovation has also been investigated as an interface between knowledge management and firm performance [15]. Research on manufacturing enterprises considers knowledge sharing as a mediator of intellectual-capital relationships [16]. These are meaningful theoretical questions when the design and measurement permit the corresponding interpretations. The question addressed here is different: what does the correlation structure imply about the overlap and distinct contributions of sharing, innovation, and trust when two outcomes are analyzed on the same terms?
The organizational setting can alter the content of sharing without altering its broad label. Research on tourism businesses studies innovation within open networks [17]; research on supply chains examines collaborative innovation activities and capabilities [18]. Work on sharing direction distinguishes the roles of absorptive capacity and individual creativity [19], while recent research on tacit knowledge management investigates its relationship with innovation capability and organizational performance [20]. These studies motivate attention to context and construct boundaries. Their coefficients are not pooled with the pharmaceutical correlations, because their populations, instruments, and units of observation are not equivalent. The literature provides interpretive distinctions, not additional observations for the calculations presented below.
A further reason to avoid a uniformly positive narrative is that sharing can involve competing organizational considerations. Research on knowledge leakage distinguishes the potential benefits of external exchange from the risks associated with unintended disclosure [21]. Nevertheless, a negative conditional coefficient is not evidence that leakage occurred. It may arise algebraically when sharing overlaps strongly with a predictor that is more closely associated with the outcome. The empirical task is therefore to identify the pattern before attaching a behavioral explanation. Failure to make this distinction can turn a descriptive coefficient into an unsupported recommendation to increase or restrict employee communication.
Correlated predictors create a particular problem for interpretation. A pairwise correlation expresses an overall association, whereas a multiple-regression coefficient expresses a conditional one. A predictor can have a small positive correlation with an outcome but a substantial negative coefficient after another predictor is included. In that circumstance, ranking variables by coefficient magnitude or by their pairwise correlations answers different questions. Contemporary demonstrations of relative-importance analysis recommend evaluating contributions across predictor subsets [22]. Methodological treatments of correlated regressors and commonality analysis likewise show why unique and shared explanatory information should not be collapsed into a single coefficient ranking [23], [24].
This study asks whether knowledge sharing, innovation, and trust exhibit comparable conditional associations and allocations of explained variance for operational and non-financial performance. Its contribution is a transparent comparison of those outcomes using one specified correlation matrix. The analysis establishes which signs follow from the published correlations, how explained variance is distributed across overlapping predictors, and whether those conclusions depend on displayed decimal precision or a stated reliability assumption. It does not introduce a new employee sample or claim that established regression and allocation procedures are newly invented. The novelty sought is an outcome-specific substantive interpretation, supported by calculations that can be checked independently.
The distinction between descriptive and causal questions governs the whole argument. Conditioning on innovation does not, by itself, reveal the effect of changing sharing while keeping innovation fixed through an intervention. Such an interpretation requires assumptions about temporal order, common causes, and the role of the conditioning variable [25]. Accordingly, the manuscript uses conditional association to describe the matrix calculation and reserves causal language for discussing what the evidence cannot establish. The principal comparison concerns the geometry of observed construct relationships: similar positive pairwise associations can coexist with different allocations of explanatory information and, for one predictor, an opposing conditional sign.
The comparison also concerns the meaning of organizational evidence. Employees can assess several aspects of the same workplace, creating associations that combine their experiences with their interpretation of survey questions. A common questionnaire provides consistent coverage, but consistency of administration does not ensure that similarly named constructs are distinct. For this reason, the present research question is framed around the relationships represented in the numerical materials. It does not assume that every construct corresponds to a separately observed organizational process. The analysis can identify a contrast requiring explanation even when it cannot identify the explanation itself.
There is a useful asymmetry between detecting and explaining suppression. Detection can follow directly from a small number of correlations and requires no speculation about managerial intentions. Explanation may require detailed knowledge of scale content, organizational roles, and the temporal relation between sharing and innovation. Keeping these tasks separate allows a precise result to remain useful without claiming more than the materials contain. The resulting interpretation is deliberately testable: a later study with individual observations can examine whether the same conditional contrast remains after measurement separation and company structure are addressed.
The numerical materials are the interconstruct correlations and reliability coefficients in Table 2 [26]; Table 1 and Section 4.1 of that article supply the demographic totals and survey description, while Table 3 is used only for an arithmetic consistency check. The survey concerned employees in twenty pharmaceutical companies selected in Lahore and Sialkot, with responses collected during June–August 2024. Company selection was described as convenient and employee selection as purposive. The instrument comprised forty-nine five-point items spanning trust, knowledge sharing, product and process innovation, operational performance, and non-financial performance. This provenance identifies the empirical origin once; the calculations below are derived from those published numerical summaries.
The accessible materials contain neither individual responses nor an item-level covariance matrix. Consequently, the analytic dataset consists of ten distinct interconstruct correlations, five unit diagonal entries, and five reported alpha coefficients. The lower triangular correlation entries are mirrored to form a symmetric matrix. The diagonal quantities displayed in the published discriminant-validity table are square roots of average variance extracted; they are not self-correlations and are therefore not placed on the diagonal of the working correlation matrix. Unit diagonal entries are required for the standardized projections. This distinction is essential because using validity coefficients as self-correlations would change the algebra and the meaning of every coefficient.
The number of survey responses cannot be reconciled from the accessible materials. The demographic categories sum to 453, whereas the collection description states 490 completed questionnaires, comprising 410 online and eighty personally administered responses. The difference is thirty-seven responses, and no documented exclusion sequence resolves it. Neither value is silently selected as the analytic sample size. The calculations use the correlations directly and do not require a sample size. Standard errors, significance tests, respondent bootstraps, and confidence intervals are therefore not supplied. The decision reflects the principle that sample-size information must correspond to the actual inferential objective and analyzed observations [27].
Knowledge sharing is denoted by KS, innovation by IN, trust by TR, operational performance by OP, and non-financial performance by NFP. The common predictor set is KS, IN, and TR. Each outcome is projected separately on the same predictors, allowing direct comparison of descriptive coefficients and variance allocations. Because the published description does not fully resolve whether the correlations are between composite scores or estimated construct scores, the primary estimand is explicitly the linear projection implied by the printed matrix. It is not presented as a recovered individual-level regression, a refitted latent-variable model, or a newly validated survey instrument.
The strongest predictor association in Table 1 is between KS and IN, at 0.688. Their relationship makes separation of marginal and conditional information especially relevant. Alpha coefficients are retained as reported quantities, not as proof of construct validity. Measurement assessment requires information beyond aggregate internal consistency [28]. Item-level procedures for discriminant validity cannot be reconstructed from five construct correlations and alpha values alone [29]. The distinction between empirical separability and measurement quality is therefore preserved throughout the interpretation [30].
| Construct | KS | IN | TR | OP | NFP | Alpha |
|---|---|---|---|---|---|---|
| KS | 1.000 | 0.688 | 0.385 | 0.618 | 0.152 | 0.937 |
| IN | 0.688 | 1.000 | 0.478 | 0.595 | 0.530 | 0.944 |
| TR | 0.385 | 0.478 | 1.000 | 0.398 | 0.223 | 0.964 |
| OP | 0.618 | 0.595 | 0.398 | 1.000 | 0.268 | 0.924 |
| NFP | 0.152 | 0.530 | 0.223 | 0.268 | 1.000 | 0.948 |
Numerical provenance: published Table 2 identified in Section II-A. Diagonal correlations are set to one. The IN–NFP entry is printed as 0.53 in that table; its rounding half-width is 0.005.
Let \(A\) be the three-by-three predictor correlation matrix and let \(b_y\) contain the three correlations with outcome \(y\). For \(y\in\{\mathrm{OP},\mathrm{NFP}\}\), the coefficient vector and explained variance are
The equation is obtained from the normal equations for standardized linear projection. It uses only second moments. A coefficient describes the association with the component of a predictor that is linearly distinct from the other two predictors. The explained variance describes the squared multiple correlation within the supplied matrix. Neither quantity measures out-of-sample prediction, because independent observations and a validation sample are unavailable. Positive definiteness is checked before inversion, and linear systems are solved directly for subset calculations to avoid unnecessary numerical inversion.
Collinearity is described using the diagonal of \(A^{-1}\), which gives variance-inflation factors for standardized predictors. These factors are used to characterize overlap, not to decide automatically whether a variable should be removed. A moderate variance-inflation factor does not preclude suppression, because suppression depends on the joint arrangement of predictor and outcome correlations. Partial correlations are also calculated from the coefficients, residual variance, and inverse predictor matrix. They provide a standardized conditional association on a correlation scale and should not be read as sampling tests.
The two outcomes can share variance even after the three predictors are considered. Let \(B\) collect both outcome correlation vectors and let \(C\) be the two-by-two outcome correlation matrix. Their residual covariance matrix is
This calculation describes how much linear association remains between the outcomes after their shared predictor relationships are removed. It does not test whether the outcomes are theoretically identical. A small residual association could result from the chosen predictors, the measurement design, or omitted relationships; its meaning remains conditional on the available construct definitions.
All seven nonempty subsets of the three predictors are evaluated. For a subset \(U\), the corresponding explained variance is \(R_y^2(U)=b_{y,U}^{\mathsf T}A_U^{-1}b_{y,U}\), with the empty-set value defined as zero. The unique contribution of predictor \(j\) is the reduction in explained variance when it is removed from the full set. This last-entry contribution answers how much explanatory information would be lost after the other predictors have already been retained. It need not equal the predictor’s stand-alone squared correlation or its average contribution across different entry orders.
To distribute the full explained variance without assigning an arbitrary predictor order, the analysis averages each predictor’s incremental contribution over all six possible orderings. For the three-predictor set \(P\), the Shapley allocation is
The allocations sum to the full explained variance. Division by that variance gives each predictor’s percentage share of explained, rather than total, outcome variance. General dominance and related order-averaged decompositions provide the methodological basis for this calculation [31], [32]. With only three predictors, exhaustive evaluation avoids random approximation and makes every increment inspectable.
The allocation is deliberately interpreted separately from coefficient sign. Adding a predictor cannot reduce the unadjusted explained variance of a nested linear projection, so its allocation is nonnegative even when its conditional coefficient is negative. A negative coefficient with a positive allocation is therefore not a contradiction. One describes direction conditional on other variables; the other describes average incremental explanatory information. This separation is particularly important for KS in the NFP equation. It also prevents a percentage allocation from being misrepresented as the percentage improvement a manager could obtain by changing a practice.
The sign reversal is first examined in the two-predictor KS–IN projection, before considering trust. Its KS coefficient is
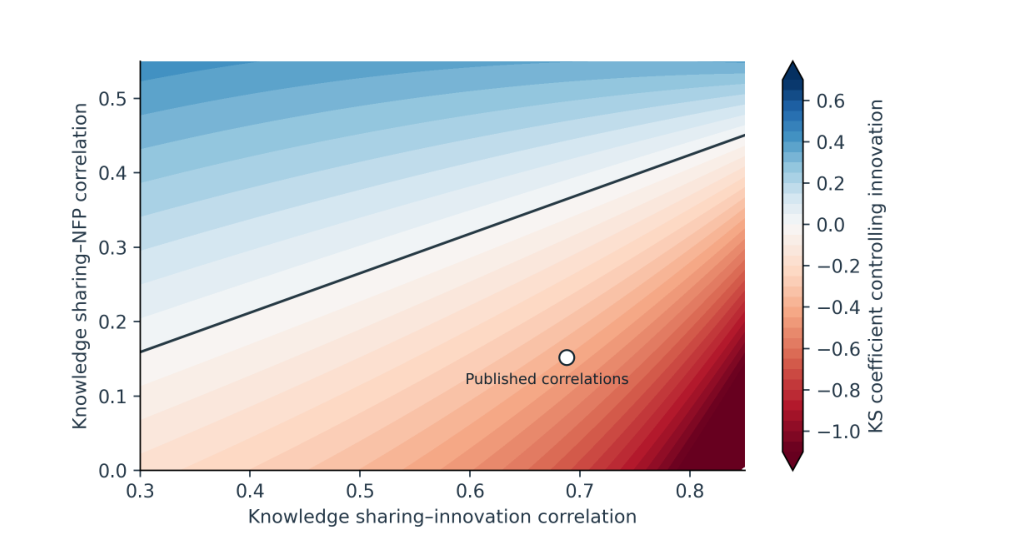
For a positive denominator, the sign is determined by whether the pairwise KS–outcome correlation exceeds the product of the other two correlations. This exact boundary explains the reversal without invoking unobserved employee behavior. The corresponding visualization varies two correlations algebraically while holding the IN–NFP correlation at its printed value. The plotted coordinates are mathematical combinations, not additional organizations or simulated survey respondents.
Displayed decimal precision is treated conservatively. Each three-decimal off-diagonal correlation may vary by 0.0005 in either direction. The IN–NFP value, displayed with two decimal places, may vary by 0.005. Symmetry and the unit diagonal are preserved. All 1,024 vertices of this ten-dimensional rounding box are evaluated as a reproducible numerical check. Vertex extrema are described only as vertex extrema: a nonlinear matrix function need not attain its full-box extrema at a vertex. A separate componentwise bound provides coverage of the interior and is used for the sign conclusions.
Write a perturbed projection as \((A+E)(\beta+d)=b+e\), with \(|E|\leq H\) and \(|e|\leq h\), where absolute values and inequalities are elementwise. Rearranging gives \(d=A^{-1}(e-E\beta-Ed)\). Define \(M=|A^{-1}|H\) and \(g=|A^{-1}|(h+H|\beta|)\). When the spectral radius of \(M\) is less than one,
The nonnegative inverse follows from the convergent Neumann series. The resulting interval \([\beta_j-q_j,\beta_j+q_j]\) is an enclosure under the rounding assumptions, not a confidence interval. Positive definiteness throughout the full matrix box is checked using the smallest eigenvalue and a symmetric perturbation norm bound. Thus, the enclosure concerns valid nearby correlation matrices rather than arbitrary ill-conditioned inputs.
An additional calculation asks how the coefficients change if each printed alpha is treated as a known classical reliability and the correlations are uncorrected score correlations. Under mutually uncorrelated measurement errors and errors uncorrelated with true scores, off-diagonal entries become \(r_{ij}/\sqrt{\alpha_i\alpha_j}\), with unit diagonal retained. Positive definiteness is checked again. This is an assumption-based sensitivity calculation, not a preferred replacement matrix. If the published correlations already represent disattenuated latent relationships, applying this transformation would be inappropriate; the primary results therefore use the untransformed entries.
Alpha need not equal the reliability of a substantively intended construct. Methodological work distinguishes its assumptions from alternative reliability estimators [33], while tutorials on omega connect reliability estimation to explicit measurement models [34]. Even model-based reliability estimates can be biased when the measurement model is misspecified [35]. The transformation is consequently used to expose dependence on one stated measurement assumption. It does not repair an unavailable measurement model, remove common reporting influences, or establish the true magnitude of the organizational relationships.
All calculations and figures are generated by a single Python script using numerical linear algebra and standard plotting libraries. The accompanying files retain the correlation matrix, precision half-widths, alpha values, every subset result, allocation, and enclosure. The script checks matrix definiteness, verifies that allocations sum to explained variance, and compares vertex results with the componentwise bounds. No random seed is needed because the computations are deterministic. The complete LaTeX project uses those generated assets, with every panel available separately. This design permits verification of the reported arithmetic without suggesting that aggregate information can reconstruct unavailable respondents.
The working correlation matrix is positive definite, with smallest eigenvalue 0.19543. The predictor matrix has smallest eigenvalue 0.30193. The variance-inflation factors for KS, IN, and TR are 1.914, 2.113, and 1.306, respectively. Thus, the calculations do not depend on a nearly singular predictor matrix. The appreciable KS–IN correlation remains substantively important, but the numerical system is sufficiently separated from singularity for direct projection. These properties allow the conditional comparison to proceed without deleting a predictor or artificially altering the correlation structure.
The operational equation has coefficients of 0.38344 for KS, 0.27415 for IN, and 0.11933 for TR. Its explained variance is 0.44758. All three conditional associations remain positive, although each is smaller than its pairwise correlation. The pattern indicates overlapping positive explanatory information. Holding the other predictors statistically constant reduces the association assigned to each variable, because part of its marginal relationship with OP is already represented by the other predictors. The partial correlations, 0.34943, 0.24597, and 0.13911, preserve the same order.
The contrast in Figure 1 is concentrated in the non-financial equation. KS changes from a pairwise correlation of 0.152 to a conditional coefficient of \(-0.40269\). IN rises from a pairwise correlation of 0.530 to a coefficient of 0.81184, whereas TR falls from 0.223 to \(-0.01003\). The corresponding partial correlations are \(-0.34356\), 0.57452, and \(-0.01102\). These values establish that positive pairwise correlations do not imply positive conditional relationships. The near-zero trust coefficient also differs from the substantial negative KS coefficient; they should not be grouped together merely because both signs are negative.
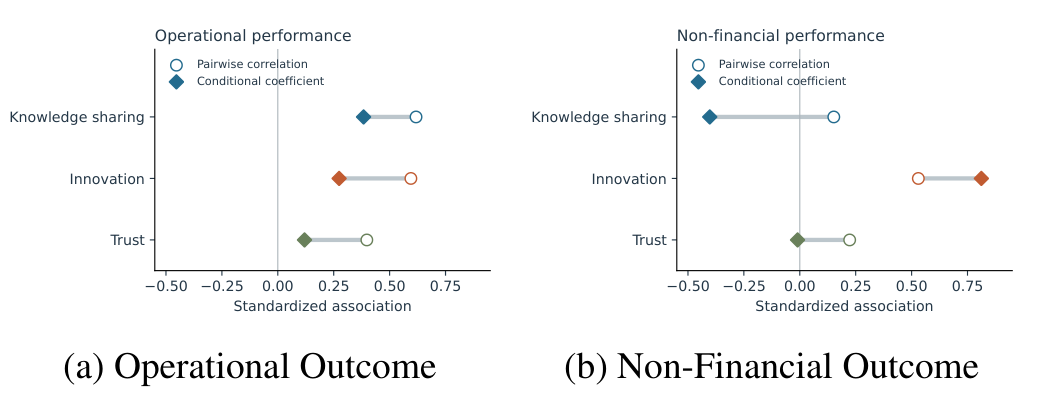
The non-financial equation explains 0.36683 of standardized variance, leaving 0.63317 unaccounted for by the linear projection. The operational equation leaves 0.55242. Those residual proportions rule out language suggesting that the three constructs explain organizational performance comprehensively. Moreover, the higher operational explained variance is a comparison within the printed matrix, not a statistically tested difference between population predictive accuracies. Without individual records, the analysis cannot estimate uncertainty around that difference or determine whether a few observations substantially influence either relationship.
The quantities in Table 2 answer complementary questions. KS has the largest operational allocation and the largest operational unique contribution. For NFP, IN has both the largest allocation and the largest unique contribution, while KS contributes meaningful explanatory information through a negative conditional association. TR’s non-financial allocation is positive because it can explain variance when entered before the other predictors; almost none of that information is unique after KS and IN are included. The allocation therefore should not be described as an independent trust effect.
The common predictor set is important for interpreting this difference. Because both outcomes use the same three predictors and the same predictor correlation matrix, the contrast does not arise from including trust in one equation and omitting it from the other. Nor does it arise from choosing different regression orders. The differences are carried by the two vectors of outcome correlations. This observation localizes the empirical question: why is KS strongly associated with OP but only weakly associated with NFP when IN is positively associated with both? The matrix answers how that arrangement affects coefficients, while leaving its organizational origin open.
| Outcome | Predictor | Coefficient | Unique \(R^2\) | Allocation | Share (%) |
|---|---|---|---|---|---|
| OP | KS | 0.38344 | 0.07683 | 0.20896 | 46.69 |
| IN | 0.27415 | 0.03558 | 0.17438 | 38.96 | |
| TR | 0.11933 | 0.01090 | 0.06424 | 14.35 | |
| NFP | KS | \(-0.40269\) | 0.08474 | 0.05111 | 13.93 |
| IN | 0.81184 | 0.31197 | 0.29362 | 80.04 | |
| TR | \(-0.01003\) | 0.00008 | 0.02209 | 6.02 |
Unique contributions are last-entry increments; allocations average increments over all predictor orders. Shares refer to explained variance. Full \(R^2\): OP, 0.44758; NFP, 0.36683.
The seven subset calculations clarify why the two equations differ. KS alone accounts for 0.38192 of OP variance, and IN alone accounts for 0.35403. Their joint explained variance is 0.43668, substantially less than the sum of their separate values. Most of their separate explanatory information overlaps. Adding TR to that pair raises explained variance by 0.01090. Operational performance is consequently associated with a combination in which sharing and innovation both carry substantial information, with trust contributing a smaller additional component.
| Predictors | OP \(R^2\) | NFP \(R^2\) |
|---|---|---|
| KS | 0.381924 | 0.023104 |
| IN | 0.354025 | 0.280900 |
| TR | 0.158404 | 0.049729 |
| KS, IN | 0.436680 | 0.366754 |
| KS, TR | 0.412005 | 0.054866 |
| IN, TR | 0.370749 | 0.282093 |
| KS, IN, TR | 0.447581 | 0.366831 |
The non-financial column in Table 3 displays a different arrangement. KS alone accounts for only 0.02310, but adding KS to IN raises explained variance from 0.28090 to 0.36675. That increment, 0.08585, exceeds the information supplied by KS alone. This is the numerical signature of suppression in the two-predictor equation: KS helps distinguish the component of innovation associated with NFP from the component shared with KS. Adding TR to the pair raises explained variance by only 0.00007694, which is very small on the scale of the outcome variance.
Removing IN from the full non-financial equation reduces explained variance by 0.31197, whereas removing KS reduces it by 0.08474. The sum of unique contributions is not required to equal total explained variance, because the predictors contain shared and suppressive components. In particular, the three non-financial unique increments sum to more than the full explained variance. This does not indicate a calculation failure. It indicates that separate last-entry comparisons overlap in how they capture suppression, reinforcing the need to distinguish deletion-based contributions from an additive allocation.
The distributions in Figure 2 show the contrast without selecting a preferred entry order. For OP, KS receives 46.69%, IN receives 38.96%, and TR receives 14.35% of explained variance. For NFP, IN receives 80.04%, KS receives 13.93%, and TR receives 6.02%. The 80.04% share corresponds to 0.29362 of total standardized NFP variance, not 80.04% of all non-financial performance. The distinction is important because the full non-financial projection explains less than forty percent of its outcome variance.
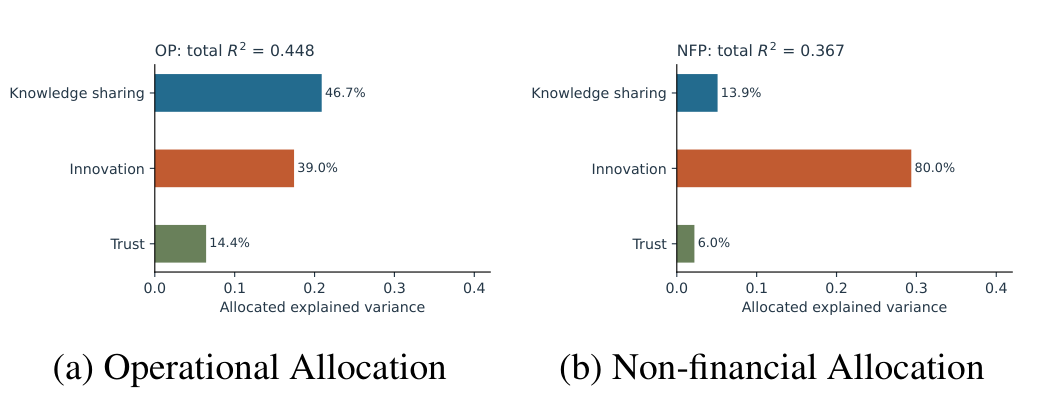
Entry order reveals the distinction in a particularly direct way. For OP, entering KS before IN assigns KS its stand-alone contribution of 0.381924; entering it after IN assigns it only 0.082655. For NFP, entering KS first assigns it 0.023104, whereas entering it after IN assigns it 0.085854. Thus, adjustment reduces the operational contribution but increases the non-financial contribution. Averaging over orders is not a cosmetic presentation choice. It prevents either of these substantively different entry positions from being treated as the only legitimate measure of explanatory importance.
The trust results provide an additional check on interpretation. When KS is the only other predictor, adding TR increases NFP explained variance from 0.023104 to 0.054866. When IN is the only other predictor, adding TR increases it from 0.280900 to 0.282093. These increments differ markedly despite referring to the same trust variable and the same outcome. The apparent explanatory contribution of trust depends on which related information is already present. This dependence is precisely what the allocation averages and what a single marginal correlation cannot communicate.
The residual outcome association also clarifies why retaining two dependent variables is useful. Before adjustment, the positive correlation could encourage an interpretation that the two scores express one common performance dimension. After projection, their remaining association is much smaller, while their coefficients differ in sign and magnitude. These observations are compatible with shared organizational information and distinct outcome content existing together. They do not justify merging the scores or declaring them unrelated. Either decision would require a measurement argument supported by the underlying items.
This distinction matters when interpreting the unexplained variance. Residual variance is not automatically attributable to managerial failure, missing knowledge, or ineffective innovation. It can include unmeasured organizational characteristics, variation in respondents’ perspectives, measurement error, and relationships outside the linear specification. The present analysis cannot partition those possibilities. Consequently, the unexplained fractions are reported as properties of the projection rather than as estimates of unrealized organizational potential. Their size limits the completeness of the statistical account, but it does not identify an intervention capable of reducing them. A defensible explanation requires observations that distinguish these competing sources of variation.
In the two-predictor NFP equation, the sign boundary for KS is \(0.688\times0.530=0.36464\). Its actual pairwise NFP correlation is 0.152, well below that boundary. The resulting two-predictor coefficient is \(-0.40376\), close to the three-predictor value of \(-0.40269\). Trust therefore does not generate the central reversal. The reversal is already implied by the three correlations linking KS, IN, and NFP. This localization reduces the temptation to explain the pattern through a trust interaction that the available second moments cannot identify.
The point shown in Figure 3 lies clearly within the negative-coefficient region. The boundary represents zero conditional KS association at a fixed IN–NFP correlation of 0.530. Moving across the surface changes an algebraic input, not an observed organization or a policy setting. The display explains the mathematical relationship among the correlations and makes clear that a positive KS–NFP correlation can coexist with a negative conditional coefficient over a broad range of admissible values. It supplies no evidence about which organizational process produced those correlations.
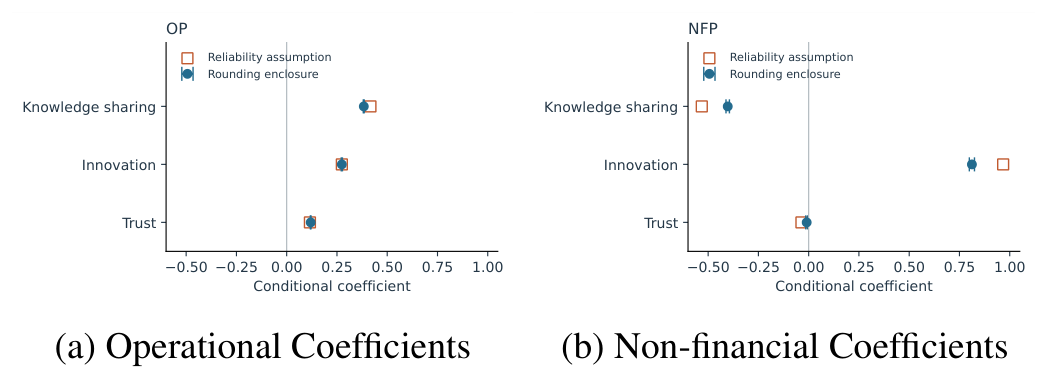
The maximum absolute row sum of the rounding-perturbation matrix is 0.0065, much smaller than the working matrix’s minimum eigenvalue of 0.19543. Every matrix in the stated rounding box therefore remains positive definite. Across its 1,024 vertices, the smallest observed eigenvalue is 0.19181. The vertex checks preserve positive KS and IN coefficients for OP and negative KS with positive IN coefficients for NFP. The componentwise enclosures in Table 4 establish these sign conclusions throughout the interior as well, rather than only at the examined vertices.
| Outcome | Predictor | Rounding lower | Rounding upper | Reliability value |
|---|---|---|---|---|
| OP | KS | 0.38104 | 0.38584 | 0.41665 |
| IN | 0.27124 | 0.27706 | 0.27447 | |
| TR | 0.11774 | 0.12092 | 0.11539 | |
| NFP | KS | \(-0.41112\) | \(-0.39425\) | \(-0.53173\) |
| IN | 0.79908 | 0.82460 | 0.96727 | |
| TR | \(-0.01437\) | \(-0.00568\) | \(-0.03601\) |
Rounding limits are componentwise bounds, not sampling intervals; endpoints are rounded outward to five decimals. Reliability values require the additional assumptions in Section 2.5.
The non-financial KS enclosure excludes zero by a substantial margin relative to the rounding allowance. Its negative sign cannot be attributed to rounding the IN–NFP correlation to two decimals under the stated assumptions. The trust enclosure is also negative, but close to zero in magnitude; excluding zero through decimal arithmetic does not establish statistical significance. No sampling uncertainty is represented by these bounds. The operational signs are likewise stable to rounding, with considerably narrower enclosures because their outcome correlations are all displayed to three decimal places.
The reliability calculation in Figure 4 preserves the main outcome contrast while changing some magnitudes. OP coefficients become 0.41665, 0.27447, and 0.11539; NFP coefficients become \(-0.53173\), 0.96727, and \(-0.03601\). The transformed matrix remains positive definite, with minimum eigenvalue 0.14633. Explained variance rises to 0.50025 for OP and 0.44776 for NFP. These increases are consequences of the assumed attenuation transformation, not evidence that the transformed values are closer to the true relationships. They show that the central reversal is not removed by this particular reliability assumption.
Finally, the pairwise OP–NFP correlation of 0.268 falls to a residual correlation of 0.06392 after the common predictor set is considered. The associated residual covariance is 0.03781. Much of the linear outcome association is therefore shared with KS, IN, and TR, although substantial variance remains unexplained in each outcome. This combination supports analyzing the outcomes separately: they share predictor-related information but do not exhibit the same conditional coefficient pattern. It does not establish that they are independent constructs or that the predictor set exhausts their common organizational causes.
The answer to the research question is that the two performance dimensions do not have comparable conditional associations with knowledge sharing. Operational performance retains a positive KS coefficient and a relatively balanced allocation between sharing and innovation. Non-financial performance is dominated by innovation’s allocation and contains a negative conditional KS coefficient. A single statement that knowledge sharing improves organizational performance would erase this difference and would also turn association into causation. The more defensible conclusion is that the printed correlations organize explanatory information differently for the two outcomes.
For operational performance, a plausible interpretation is that sharing and innovation contain related information about coordinated organizational activity. Their high separate explained variances and smaller joint increment are consistent with employees describing connected aspects of organizational functioning. This interpretation remains at the level of construct relationships. The evidence does not show that employees reduced production errors, accelerated batch release, or improved delivery times. Those are specific operational events that would require corresponding records. The distinction prevents the pharmaceutical context from supplying an apparently concrete business result that was never measured in the accessible materials.
For non-financial performance, the suppression pattern requires more care. A higher KS value at a given level of IN and TR is associated with a lower NFP value in the implied projection. That statement does not mean that organizations should discourage sharing. It describes a residual contrast: the part of KS not linearly shared with the other predictors. If the sharing scale includes activities poorly captured by the innovation measure, if the innovation score absorbs substantively relevant sharing-related variation, or if common causes affect both measures, the conditional coefficient can differ from the relationship produced by an intervention. The available matrix cannot discriminate among these possibilities.
The high IN coefficient should be interpreted with the same restraint. A coefficient of 0.81184 does not show that innovation produces an eighty-one percent improvement in performance, nor does it establish a stronger causal effect than sharing. It indicates the standardized slope of the implied conditional linear projection. The NFP construct includes an innovation-and-learning perspective, so conceptual proximity between predictor and outcome deserves particular attention. Without item wording and item-level associations, it is impossible to determine how much of the relationship reflects distinct organizational content and how much reflects overlapping measurement. High internal consistency does not resolve that question.
The contemporary knowledge-management literature remains useful when applied at this level of specificity. Leadership-supported sharing, open innovation, and tacit knowledge processes describe different organizational arrangements. They should not be collapsed into a claim that all knowledge exchange has one measurable performance consequence. The present comparison adds a diagnostic question to such substantive accounts: does the relationship persist in the same direction when the correlated innovation and trust constructs are considered? In this matrix, the answer depends on the outcome. That finding narrows the interpretation rather than contradicting every study reporting a positive sharing association.
The two outcome labels also differ in breadth. A broad non-financial assessment may combine several judgments that do not respond together, whereas an operational assessment may emphasize a more concentrated set of activities. Aggregation can obscure opposing subscale relationships. Here, the accessible correlations do not separate customer perspective, innovation and learning, and internal business processes. Accordingly, the negative KS coefficient cannot be assigned to any one of these components. The same restriction applies to IN: the available aggregate does not identify whether product or process innovation carries the association. Specifying these limits is more informative than attributing the results to an unobserved business mechanism.
The comparison should also not be read as a competition in which innovation wins and sharing loses. IN and KS are correlated, and the largest non-financial allocation is calculated within a predictor set containing both. Removing sharing would change the interpretation and magnitude of the remaining coefficients, even though innovation would still carry substantial marginal information. The allocation assigns explanatory credit within a statistical representation; it does not identify substitutable organizational investments. An intervention that changes one practice could also change another, which lies outside the fixed-correlation comparison performed here.
Trust’s small unique NFP contribution illustrates the difference between redundancy and irrelevance. It explains some variance when considered alone and receives a positive average allocation, yet adds almost no explained variance after KS and IN are included. This means its linear information about NFP is largely represented by those predictors in the supplied matrix. It does not show that trust is unimportant for employee relationships or that it could be removed without organizational consequences. An enabling condition can share information with the activities it supports. Cross-sectional aggregate correlations cannot identify that role or distinguish it from reverse association.
Moderation is a separate question. Estimating an interaction between trust and knowledge sharing would require information about the product term, including moments that are not contained in the five-variable correlation matrix. A pairwise trust correlation cannot substitute for those quantities. Consequently, the present model includes trust as a companion predictor and does not estimate a moderating effect. This choice is dictated by identifiable information rather than by a judgment that moderation is theoretically implausible. Retaining the distinction avoids treating a main-effect projection as if it had evaluated the original interaction hypothesis.
Mediation also requires more than a compelling diagram. Cross-sectional mediation coefficients need not represent longitudinal processes [36]. Methodological work on indirect effects separates the estimation of a statistical product from broader claims about a mechanism [37]. The numerical materials contain a further reason for caution: the printed path coefficients 0.65 and 0.33 multiply to 0.2145 for the operational chain, whereas the corresponding table lists 0.395. The coefficients 0.65 and 0.61 multiply to 0.3965 for the non-financial chain, whereas the listed indirect value is 0.213. These are arithmetic discrepancies, not differences resolved by choosing a different verbal description.
Those path values are not substituted into the projection calculations, and the discrepancy is not repaired by relabeling outcomes without documentary support. Different structural specifications or scaling conventions can yield coefficients different from a simple projection, but a coherent interpretation requires those specifications to be known. The present analysis therefore establishes a self-contained algebraic result from the correlation matrix while leaving the inconsistent path report unresolved. It cannot validate claims of complete mediation, and it does not use its conditional negative coefficient to infer that a causal direct effect must be negative.
The decimal sensitivity analysis addresses a narrow but concrete concern: whether the central sign reversal could disappear within the precision with which the correlations are printed. It cannot. The componentwise enclosure supports that conclusion for every admissible perturbation in the specified box. However, the box does not represent sampling variation, measurement-model uncertainty, respondent selection, company clustering, or transcription errors larger than the rounding allowances. Stability within one class of perturbations is not a general certificate of empirical robustness. The result should be reported with the perturbation class attached.
The reliability calculation answers another limited question. Under classical independent measurement errors and the assumption that the printed entries are uncorrected score correlations, scaling by alpha does not remove the reversal. That persistence is informative about this transformation but is not evidence that measurement error has been controlled adequately. Alpha values could be unsuitable reliability estimates for the intended constructs, and systematic reporting influences could produce correlated errors. The possibility that the entries are already construct-level correlations further limits the transformation’s substantive interpretation. The untransformed matrix accordingly remains the basis for the principal conclusions.
Common reporting influences are especially relevant when the same respondents assess sharing, innovation, trust, and performance. Contemporary reviews describe common-method bias as involving several processes that cannot be ruled out by a single simple diagnostic [38]. The accessible summary tables do not permit estimation of a method factor or comparison with independently recorded outcomes. Nor can they identify which associations would change after controlling for omitted organizational characteristics. Sensitivity approaches to omitted-variable bias require explicitly defined estimands and assumptions [39]; decimal perturbation cannot stand in for such an analysis. The present calculations are consequently not described as adjusted for unmeasured confounding.
The distinction between employee and company information is equally important. Employees were selected within twenty companies, but the matrix does not provide company identifiers, within-company correlations, or cluster sizes for the analyzed observations. An employee-level association can differ from an association among company means. Treating several hundred employee responses as several hundred independent organizations would therefore overstate the level of evidence. The uncertain analytic sample size compounds this issue. Avoiding significance tests does not eliminate selection and clustering concerns; it simply prevents those unknowns from being hidden inside unjustified standard errors.
External validity is restricted by the sampling description and geographic coverage. The evidence concerns selected respondents in Lahore and Sialkot, not a probability sample of Pakistan’s pharmaceutical sector. Generalization requires attention to the population, measurements, and sampling units over which a conclusion is intended to hold [40]. No national estimate, international comparison, or policy effect is warranted here. Even a correctly calculated matrix result may change when a different workforce, instrument, or time period is considered. The contribution is the explicit outcome contrast in these numerical materials, not a universal law of knowledge sharing.
The unresolved sample accounting deserves a specific interpretation. The demographic totals are internally consistent across gender, age, experience, and education, all referring to 453 people. The collection description is also arithmetically consistent within its own account, since the two administration modes sum to 490. The problem is the missing connection between these accounts. It would be inappropriate to infer that thirty-seven respondents were excluded for poor quality, missing answers, or any other reason, because no such disposition is documented. Reporting the discrepancy without inventing its explanation preserves the evidence needed for a later resolution.
The uncertainty also affects what can be said about the precision of the new coefficients. Choosing 490 because it is larger would make conventional sampling intervals appear narrower than choosing 453, but neither choice would address unknown company dependence or the nature of the construct correlations. A significance calculation built on those choices would add numerical detail without establishing that its assumptions apply. By contrast, the rounding enclosure requires only the stated precision of the displayed correlations and an explicit matrix perturbation argument. The two kinds of uncertainty are therefore kept separate for a substantive reason, rather than because sampling variability is unimportant.
For organizational assessment, the findings favor keeping performance dimensions separate and reporting both marginal and conditional relationships. A dashboard that combines operational and non-financial assessments into one undifferentiated index could conceal the observed contrast. The analysis does not establish which weighting scheme a company should adopt, but it does show why the choice would matter. Similarly, a ranking based only on standardized coefficients would miss the distinction between direction and explanatory allocation. Reporting coefficients together with subset contributions makes the interpretation more transparent without implying that the allocation determines investment priorities.
A practical implication is methodological rather than prescriptive: before interpreting a positive sharing association as evidence for a particular management action, examine which outcome is measured and which correlated constructs enter the model. If innovation accounts for most of the explained variance of an outcome containing learning-related items, item content and construct separation should be inspected. If trust adds almost no unique variance, its marginal contribution should not be relabeled as an independent effect. These checks improve the accuracy of interpretation while leaving actual management choices dependent on evidence about costs, feasibility, and observed organizational consequences.
The most useful additional evidence would resolve specific uncertainties identified by the calculations. An anonymized respondent file with company identifiers would permit verification of the analysis sample, examination of clustering, and inspection of influential observations. Item wording and item-level covariance information would clarify whether innovation and the innovation-and-learning portion of NFP are empirically distinguishable. Repeated measurements with documented timing would make temporal questions assessable, and independently recorded operational outcomes would separate employee perceptions from business records. These are requirements for stronger claims, not descriptions of work already conducted in this manuscript.
The present computational contribution remains useful within those limits. It demonstrates that a moderately correlated, well-conditioned matrix can yield a stable negative conditional association alongside a positive pairwise relationship. It also shows that a predictor’s average allocation and its unique last-entry contribution can differ substantially. The resulting paper is therefore an analytical study of outcome-dependent association, rather than a report of a newly conducted pharmaceutical experiment. Its value rests on transparent arithmetic and disciplined interpretation, with all numerical inputs available for independent inspection.
Reproducibility in this setting has a clearly bounded meaning. Another reader can reconstruct the matrices, obtain the same conditional coefficients, verify the seven subset values, and regenerate each plot. That reader cannot recover employees’ responses, validate the questionnaire, or determine the effect of a managerial intervention from the accompanying files. Preserving this distinction prevents computational completeness from being mistaken for completeness of empirical documentation. The package provides all information used in the calculations and identifies the information that was unavailable, allowing later empirical work to build on the exact finding without inheriting unsupported assumptions.
Knowledge sharing, innovation, and trust do not exhibit a common conditional association pattern across the two performance dimensions examined here. The published correlation matrix implies positive operational coefficients for all three predictors, with knowledge sharing receiving the largest allocation of explained variance. For non-financial performance, innovation receives 80.04% of explained variance, knowledge sharing has a negative coefficient despite its positive pairwise correlation, and trust contributes almost no unique explanatory information. The knowledge-sharing reversal is already present when innovation is the only companion predictor and persists throughout the stated rounding enclosure.
The substantive conclusion is therefore specific: positive sharing–performance correlations are insufficient to establish that sharing relates to operational and non-financial outcomes in the same way after innovation is considered. The results identify statistical suppression and different distributions of explanatory information. They do not show that reducing sharing improves performance, that innovation causally transmits its influence, or that trust lacks organizational value. Unavailable individual observations, uncertain sample accounting, and unresolved measurement details prevent those stronger interpretations. The reproducible matrix calculations provide a precise basis for examining the outcome distinction while preserving the boundary between mathematical implication and empirical causation.
The accompanying project contains the correlation inputs, reliability values, deterministic analysis code, numerical results, separate figure panels, and LaTeX files. No respondent-level records were available for this analysis. Numerical provenance and the limits of the materials are described in Section II-A.
The author declares no conflicts of interest.
The author received no specific funding for this research.