
Nitrogen management in soil-grown greenhouse tomato must reconcile a long harvest period with changing plant demand and substantial nitrogen already present in the root zone. A fertilizer rate therefore acquires agronomic meaning only when the accompanying organic amendments, soil nitrogen supply and harvested product are specified. The same quantity of mineral nitrogen may represent a small supplement in a fertile, repeatedly amended soil and the principal nitrogen supply in a less fertile soil. Contemporary vegetable nutrition research consequently treats fertilizer requirement as the difference between crop demand and accessible nitrogen from other inputs, subject to the timing and spatial distribution of that supply [1]. This distinction is particularly consequential when a treatment is described by its percentage reduction in mineral fertilizer. Wider nitrogen-management analyses similarly connect production and environmental pressure while recognizing differences among agricultural systems [2].
Tomato responses to nitrogen cannot be represented adequately by yield alone. Fruit production, vegetative growth, water use and fruit composition respond differently as nitrogen supply changes. A global synthesis of tomato studies found substantial variation associated with growing conditions and management, demonstrating that a rate favorable for one outcome need not be favorable for every outcome [3]. Similarly, research on greenhouse tomato cultivation across China identified strong variation in agronomic nitrogen efficiency and its controlling factors [4]. These findings motivate comparisons that retain the physical meaning of each outcome. Fresh fruit yield describes marketed biomass; plant nitrogen accumulation describes acquisition and storage; their relationship does not establish how much of the acquired nitrogen leaves the greenhouse in harvested fruit.
Such distinctions matter because protected vegetable production can combine high productivity with persistent nutrient accumulation. Analyses of Chinese vegetable management have demonstrated that agronomic improvement and reduced environmental pressure can occur together when nutrient and production decisions are coordinated [5]. Nevertheless, greenhouse soils differ markedly in cultivation history, amendment composition and irrigation practice. A review of environmental soil quality under Chinese greenhouse vegetable cultivation described nutrient accumulation, acidification and salinization among the consequences of intensive management [6]. These observations do not imply that every greenhouse experiences the same degree of degradation. They establish why a fertilizer comparison should report the complete nitrogen input and its accounting boundary before interpreting a reduction as an environmental improvement.
The environmental significance of nitrogen remaining outside the harvested product also requires care. Greenhouse vegetable systems have been identified as important locations of nitrogen leaching and nitrous oxide emissions, although their losses vary with production conditions [7]. A systematic analysis of intensive plastic-shed vegetable production further identified a nonlinear relationship between nitrogen application and nitrous oxide emission [8]. Neither finding permits an unmeasured loss to be assigned to a particular treatment. Nitrogen not recovered in a sampled plant may remain in soil organic or inorganic forms, reside in unsampled roots, or leave through several transport and transformation pathways. An input–uptake difference is therefore an accounting quantity that helps identify unresolved nitrogen, rather than a direct measurement of pollution.
Organic amendments make the definition of input especially important. Animal manure supplies nitrogen together with carbon and other nutrients, and its agronomic contribution cannot be described by its mineral nitrogen concentration alone. A meta-analysis of Chinese cropping systems found that partial replacement of synthetic fertilizer by manure and complete replacement produced different yield and environmental responses [9]. A wider synthesis likewise documented trade-offs among crop productivity, reactive nitrogen losses and soil carbon when livestock manure was recycled [10]. In a treatment series receiving an equal manure application, the organic nitrogen is held constant but remains part of the nitrogen added. Removing it from the denominator changes what a calculated productivity value represents.
Total amendment nitrogen and nitrogen available during one crop are nevertheless separate quantities. Mineralization and microbial immobilization govern the release and temporary retention of organic nitrogen, and their rates depend on amendment characteristics and the receiving environment. Geisseler and colleagues showed, through a literature survey and model fitting, that organic fertilizers and composts differ substantially in their nitrogen turnover [11]. Consequently, including all amendment nitrogen in a gross input ledger does not assume that all of it becomes immediately available to tomato roots. Conversely, uncertainty about its short-term availability does not justify counting the amendment as nitrogen-free. Maintaining separate gross-input and availability concepts permits a transparent comparison without inventing a mineralization coefficient.
This denominator issue extends to the interpretation of nitrogen-use efficiency. Yield divided by applied mineral nitrogen describes production relative to one purchased input, whereas yield divided by mineral plus organic nitrogen describes production relative to the complete quantified fertilizer addition. Neither ratio isolates the causal contribution of fertilizer to yield. Apparent recovery instead compares plant nitrogen accumulation in a fertilized treatment with an appropriate reference treatment, as illustrated in tomato grown on sandy soils [12]. Where the reference also receives manure, that contrast concerns the added mineral treatment under a common organic amendment. It does not describe recovery from an absence of all fertilizer nitrogen. Explicit definitions prevent numerically different calculations from being treated as interchangeable measures.
Choosing a fertilizer rate also depends on the objective of the comparison. A treatment with the largest fruit yield may differ from the treatment producing the most fruit per unit nitrogen added, and neither necessarily provides the most favorable fruit composition or economic return. A multiyear greenhouse tomato investigation considered yield, crop water productivity, nitrogen productivity and quality as distinct management objectives [13]. Research combining nitrogen and irrigation deficits similarly evaluated fruit quality and cultivation profit in addition to production [14]. These examples support presenting the response to an additional quantity of nitrogen directly. Such a comparison reveals whether increased input corresponds to greater harvested yield or predominantly to additional nitrogen accumulation elsewhere in the plant.
Water supply is an essential condition of these responses. Nitrogen movement toward roots, retention within the rooting depth and movement below that depth all depend partly on water distribution. A meta-analysis of tomato production identified opportunities for coordinated water and nitrogen saving [15], while a Chinese synthesis reported improvements in yield and resource-use efficiency associated with drip fertigation [16]. However, a nitrogen-rate experiment with a fixed irrigation regime cannot separate the contribution of water management from fertilizer rate or establish the performance of another irrigation system. Its conclusions remain conditional on the water regime actually represented. This restriction is especially relevant when translating a favorable treatment comparison into a practical prescription.
Studies measuring nitrogen export reinforce the importance of that condition. Drip fertigation has been shown to reduce nitrogen leaching in solar greenhouse vegetables, including both nitrate and dissolved organic nitrogen [17]. Across consecutive plastic-shed vegetable crops, irrigation amount exerted a dominant influence on mineral nitrogen leaching [18]. These findings indicate that documenting fertilizer additions and plant removal is necessary but insufficient for a complete nitrogen balance. Changes in soil storage and drainage must also be observed if losses are to be quantified. In their absence, the defensible interpretation is limited to the measured crop response, the specified input boundary and the nitrogen quantities left unresolved by those observations.
Plant allocation provides another distinction that whole-plant accumulation can obscure. Nitrogen retained in stems, leaves and roots has a different immediate removal pathway from nitrogen exported in harvested tomatoes. A rise in whole-plant nitrogen uptake can therefore coexist with a smaller change in fruit nitrogen. Fertilizer tracing helps distinguish nitrogen derived from a labeled application from nitrogen acquired from unlabeled pools, but recovery remains sensitive to experimental conditions. Greenhouse tomato research has shown that irrigation pattern and labeled nitrate depth influence nitrogen uptake [19]; alternate partial root-zone fertigation has also affected fertilizer-nitrogen utilization [20]. These studies support interpreting tracer observations within their own treatment conditions rather than equating them automatically with recovery calculated from a separate yield trial.
Stage-specific measurements can describe when nitrogen accumulates without independently establishing an optimal application schedule. Nitrogen measured in fruit at a later date can reflect continuing root uptake, internal redistribution, or both, unless the design distinguishes these processes. Practical adjustment of fertilizer timing consequently benefits from crop and soil nitrogen monitoring, for which established approaches include tissue assessment, optical measurements and soil testing [21]. The present investigation asks how an equal organic nitrogen addition changes the interpretation of mineral-fertilizer reduction, whether additional plant nitrogen is allocated to harvested fruit, and how apparent recovery differs from the attribution supported by isotope observations. It addresses these questions through explicit nitrogen ledgers, treatment contrasts and organ-level accounting, with conclusions confined to the available crop and tracer measurements.
The observational basis is the 2019–2020 cultivation record for the tomato cultivar Pantailang at the Shouguang Facility Agriculture Research and Development Center, Zhaili Village, Shandong, China, at \(36^{\circ}54’\mathrm{N}\) and \(118^{\circ}51’\mathrm{E}\). The numerical measurements and treatment descriptions provide the soil, greenhouse environment, daily supply schedule, and sampling calendar [22]. The present work calculates a treatment-level analytical dataset from those measurements. No additional cultivation, chemical determination, or field sampling was undertaken. This choice preserves a clear distinction between stated numerical values and quantities implied by arithmetic.
The cultivation used natural light and root-zone drip delivery. Each plot occupied 16.38 m\(^2\) and initially contained 54 plants, corresponding approximately to the stated density of 33,000 plants ha\(^{-1}\). The planting description specifies two rows per ridge, 140 cm between rows, and 45 cm between plants. Three plants were destructively sampled at each of the first two crop-stage observations, with 48 remaining plants used for final yield assessment. The separate isotope experiment used three replicates of 32.76 m\(^2\), two plants per intermediate sampling, and ten plants at the final sampling. Its urea contained 5.14 atom% \(^{15}\)N. These two observation streams are retained separately because neither shared treatment wording nor matching terminal dates establishes that their nitrogen pools can be combined.
The conditions in Table 1 define the setting of the calculations. Soil total nitrogen describes a stock containing both readily available and less accessible forms; it is not substituted for mineral nitrogen availability. The greenhouse temperature and moisture ranges characterize the cultivation but do not provide a daily exposure record. Nitrogen mineralization rates, drainage volumes, and gaseous fluxes cannot be recovered from those ranges. No amendment composition, seasonal release coefficient, or irrigation-water nitrogen concentration is assigned where none is supplied.
| Property | Value in the 0–20 cm layer | ||
|---|---|---|---|
| Organic matter | 22.93 g kg\(^{-1}\) | ||
| Total N, P, K | 1.35, 1.51, 2.78 g kg\(^{-1}\), respectively | ||
| Bulk density; pH | 1.17 g cm\(^{-3}\); 7.19 | ||
| Environment | Seedling | Flowering | Fruiting |
| Day temperature (\(^{\circ}\)C) | 25–30 | 21–25 | 23–26 |
| Night temperature (\(^{\circ}\)C) | 12–16 | 14–17 | 14–17 |
| Minimum night (\(^{\circ}\)C) | 5 | 8 | 10 |
| Air humidity (%) | 80–85 | 70–80 | 70–80 |
| Soil moisture (% capacity) | 75–90 | 80–95 | 75–85 |
Values credited to Wang et al., Tables 1 and 2. Soil moisture refers to maximum soil water-holding capacity. The density unit is written dimensionally as g cm\(^{-3}\).
Plants were removed with roots, cleaned, dried, separated into aboveground and underground material, ground, and sieved below 0.150 mm. Total nitrogen was determined with a VarioMACRO cube elemental analyzer, and isotope abundance with a Finnigan Delta plus XP mass spectrometer. Vitamin C determination used 2,6-dichlorophenolindophenol, while nitrate and nitrite were determined by ultraviolet–visible spectrophotometry. These measurements establish the observational methods retained in this paper. Fruit-quality findings are discussed only at their utilized resolution; no new concentration values, analytical detection limits, or food-safety thresholds are assigned.
The plot observations were dated 12 December 2019, 9 March 2020, and 7 May 2020. The isotope observations were dated 23 November, 2 December, 12 December, and 31 December 2019, followed by 11 February, 7 March, 19 March, 13 April, and 7 May 2020. This calendar is credited to Table 4 of the cultivation record. The sequence spans seedling growth, flowering through first harvest, and the harvest period. The dates are retained individually because the numerical day labels used in the uptake graphics are not fully consistent with the calendar. Likewise, the three scheduled stage durations sum to 172 days, whereas the final graphical sampling label is day 178. Neither description is silently stretched to fit the other, and the temporal observations are not used to estimate a daily acquisition rate.
All six treatments received an organic fertilizer input \(O=285\) kg N ha\(^{-1}\). CT therefore denotes no mineral nitrogen addition, while retaining the common organic amendment. The stated reference mineral rate is \(F_{100}=147.85\) kg N ha\(^{-1}\). The primary calculation defines \(F_i=t_iF_{100}\), with \(t_i=0,0.4,0.6,0.8,1.0,1.2\). This generates the nominal dose convention used throughout the main comparisons. Because the used abstract instead associates N60 and N80 with 93 and 128 kg N ha\(^{-1}\), those two values are evaluated separately as an input-description sensitivity check. They are not averaged with the percentage-derived doses.
Let \(V_i\) and \(H_i\) denote non-fruit plant nitrogen and fruit nitrogen, respectively, expressed per hectare. The word plant here includes the measured vegetative and root material while excluding the separately reported fruit compartment. The retained conversion from dry matter to compartment nitrogen is
where dry matter \(M_x\) is expressed in kilograms per hectare and nitrogen concentration \(C_x\) in grams per kilogram. The conversion yields kilograms of nitrogen per hectare. Three directly interpretable quantities are
Here \(I_i\) is counted external nitrogen input, \(U_i\) is nitrogen in the two crop compartments, and \(h_i\) is the fruit fraction of that crop nitrogen. The ratios \(U_i/I_i\) and \(H_i/I_i\) describe crop or fruit nitrogen relative to counted input. They are not fertilizer-origin recovery fractions: the numerator can contain nitrogen from existing soil pools and other unquantified inputs. Explicit denominators are essential when organic additions and crop nitrogen acquisition are both substantial [23].
The retained difference method and its compartment decomposition are
where \(A_i=A_{V,i}+A_{H,i}\) for \(F_i>0\). CT has no defined value because its denominator is zero. Multiplication by 100 expresses these quantities as percentages. Differences in total crop uptake can include treatment-associated changes in uptake of unlabelled nitrogen; consequently \(A_i\) is called apparent recovery throughout [24]. Contrasts between N60 and each larger nominal dose use \(\Delta F\), \(\Delta V\), \(\Delta H\), and \(\Delta U\). They are finite differences between used treatment means and do not estimate the response to an infinitesimal fertilizer increment.
The arithmetic remainder \(B_i=I_i-U_i\) is also retained. It compares counted inputs with nitrogen present in the measured crop compartments and has no automatic interpretation as pollution, end-of-season soil storage, or a complete nitrogen balance. A field boundary would additionally require soil-stock change, residue disposition, drainage, gaseous transfers, and other inputs [25]. These requirements determine the limits of every subsequent interpretation of \(B_i\).
For CT, N40, N60, N100, and N120, both terminal compartment masses are printed numerically. N80 provides \(V_{80}=212.9\) kg N ha\(^{-1}\) and a fruit fraction of 37.7%, but no explicit terminal fruit mass in the narrative. Its fruit nitrogen is therefore calculated as an implied value,
The calculation does not create a new observation. Under rounding to the nearest displayed digit, \(V_{80}\in[212.85,212.95]\) and \(r\in[0.3765,0.3775]\). Monotonicity gives lower bounds by inserting both lower endpoints and upper bounds by inserting both upper endpoints. Other printed compartment masses receive rounding limits of \(\pm0.05\) kg N ha\(^{-1}\). Apparent-recovery intervals additionally include the CT total between 254.3 and 254.5 kg N ha\(^{-1}\). Nominal fertilizer rates are held fixed within this arithmetic check; their conflicting description is assessed separately.
These intervals describe printed precision, not sampling uncertainty or confidence. The calculations are ratios of treatment means rather than means of plant-level ratios, a distinction that matters for normalized variables [26]. Replicate measurements and their covariance are unavailable, so no new significance tests, regression standard errors, confidence limits, or equivalence tests are produced. The cultivation record used three-replicate summaries, Kolmogorov–Smirnov normality checks, Levene variance checks, and least-significant-difference comparisons at a 0.05 significance level. Its treatment comparisons remain contextual evidence and are not reassigned to the newly calculated quantities.
Because N60 and N80 use the same CT total, their recovery difference is additionally bounded with that shared value retained in both terms. The difference equals \(U_{80}/F_{80}-U_{60}/F_{60}+U_{\mathrm{CT}}(1/F_{60}-1/F_{80})\). Its lower endpoint uses the lower N80 total, upper N60 total, and lower CT total; its upper endpoint uses the opposite endpoints. This direct calculation avoids treating a common comparator as two independent uncertain observations. It addresses whether the ordering can change within printed precision, while making no probabilistic statement about which ordering is more likely.
To distinguish total organic nitrogen from its contribution to the crop, let \(f\in[0,1]\) denote the fraction of the current organic input appearing in measured crop nitrogen. This is an unknown contribution fraction, not an estimated mineralization rate or fertilizer replacement value [27]. Even allowing complete capture of the mineral dose, additional nitrogen from outside the two current fertilizer inputs must satisfy
The curve \(D_i(f)\) is a conditional lower bound. The threshold \(f_i^{*}\) states the organic contribution needed to eliminate that bound under complete mineral capture. It does not measure amendment availability. Existing soil nitrogen, earlier amendments, irrigation water, and transplant nitrogen remain possible contributors. A zero lower bound does not establish their absence, and incomplete mineral capture raises the additional requirement. Variable fertilizer replacement values in long-term amendment comparisons further discourage assigning a universal value of \(f\) [28].
The isotope-origin calculation retains the abundance-difference equation,
where \(N_x\) is compartment nitrogen, \(a_x\), \(a_0\), and \(a_f\) are compartment, natural, and fertilizer isotope abundances, and \(F_{\mathrm{tr}}\) is the tracer fertilizer denominator. Terminal printed recoveries of 13.8% for each compartment are summed only within that common percentage definition. The direct plant value of 20.2 kg N ha\(^{-1}\) is not used to force agreement with a percentage generated using an uncertain denominator. Unlabelled nitrogen remains a mixture of possible origins; tracer exclusion alone does not identify it as native soil nitrogen [29].
Daily water, phosphorus, and potassium quantities are multiplied by the stated stage durations of 30, 88, and 54 days and by 33,000 plants ha\(^{-1}\). The resulting values are scheduled totals. Fertigation could be omitted on cloudy or rainy days, and no event log is available; scheduled water therefore is not measured irrigation. Elemental phosphorus and potassium are kept separate from the stated oxide fertilizer quantities. The nine dated isotope samples are retained as dates rather than interpolated into a continuous uptake trajectory. A Python script and machine-readable treatment and schedule files accompany the manuscript. The script computes all tables, rounding limits, dose contrasts, and figure coordinates from explicit inputs without stochastic resampling or invented replicate records.
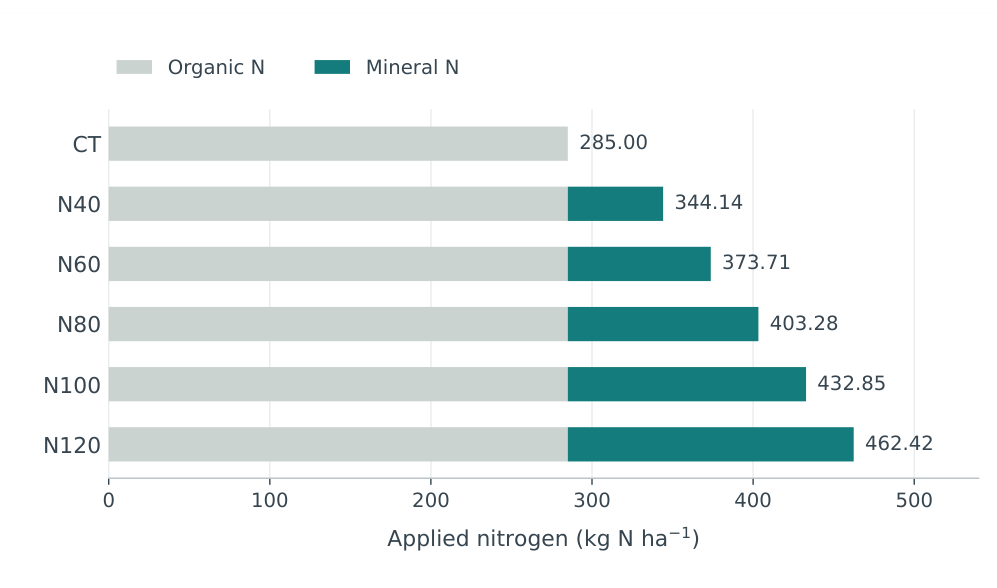
The nominal mineral inputs increase from zero in CT to 177.42 kg N ha\(^{-1}\) in N120, but the counted total input ranges from 285.00 to 462.42 kg N ha\(^{-1}\) because of the equal organic addition. The input composition is displayed in Figure 1, and the associated crop quantities are listed in Table 2. At N60, organic fertilizer supplies 76.26% of counted fertilizer nitrogen; even at N120, it supplies 61.63%. The treatment percentages consequently describe variation in one component of the input rather than proportional variation in the complete fertilizer supply.
The change from N100 to N60 removes 59.14 kg mineral N ha\(^{-1}\). Relative to the N100 mineral dose this is a 40.00% reduction, whereas relative to its total fertilizer input of 432.85 kg N ha\(^{-1}\) it is a 13.66% reduction. Moving from N100 to N80 removes 29.57 kg N ha\(^{-1}\), corresponding to 20.00% of mineral input and 6.83% of total input. The distinction is not a correction factor for amendment availability. It describes the mass of nitrogen applied, before any assumptions about subsequent transformations or uptake.
The crop-to-input ratio equals 89.26% in CT, 85.55% in N60, 76.31% in N100, and 70.28% in N120. CT’s high ratio is compatible with substantial crop nitrogen acquisition under the organic amendment and existing soil conditions; it does not show that 89.26% of the amendment itself was recovered. The figure and table together show why a mineral-only denominator would be especially misleading for CT: crop nitrogen is positive while mineral addition is zero. No mineral-input productivity ratio is assigned to that treatment.
| Treatment | \(F_i\) | \(I_i\) | \(V_i\) | \(H_i\) | \(U_i\) | \(h_i\) (%) | \(A_i\) (%) |
|---|---|---|---|---|---|---|---|
| CT | 0.00 | 285.00 | 142.5 | 111.9 | 254.4 | 43.99 | – |
| N40 | 59.14 | 344.14 | 166.7 | 117.2 | 283.9 | 41.28 | 49.88 |
| N60 | 88.71 | 373.71 | 179.4 | 140.3 | 319.7 | 43.88 | 73.61 |
| N80 | 118.28 | 403.28 | 212.9 | 128.83\(^{\dagger}\) | 341.73\(^{\dagger}\) | 37.70 | 73.84\(^{\dagger}\) |
| N100 | 147.85 | 432.85 | 206.8 | 123.5 | 330.3 | 37.39 | 51.34 |
| N120 | 177.42 | 462.42 | 201.1 | 123.9 | 325.0 | 38.12 | 39.79 |
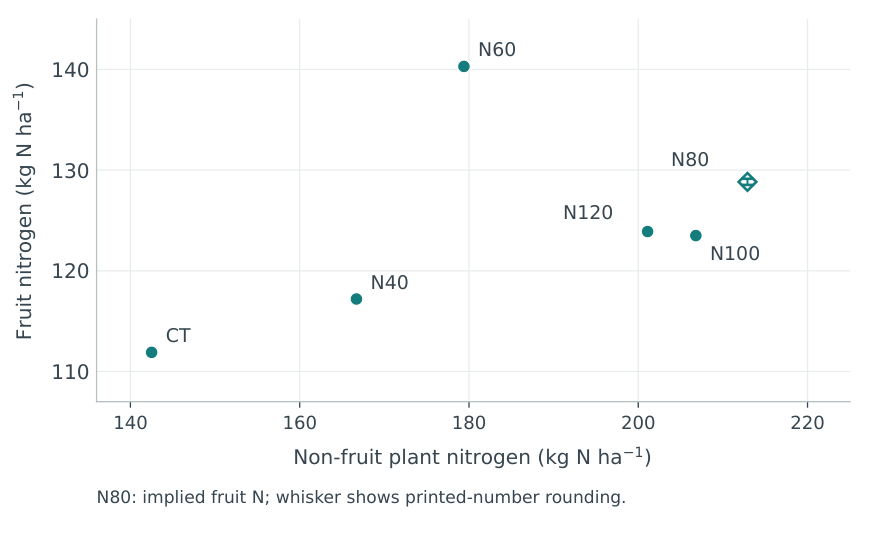
Terminal crop nitrogen is 254.4 kg N ha\(^{-1}\) in CT and increases to 319.7 in N60, 330.3 in N100, and 325.0 in N120. This ordering differs from the fruit compartment, which contains 111.9, 140.3, 123.5, and 123.9 kg N ha\(^{-1}\), respectively. The compartment plane in Figure 2 places N60 at a larger fruit nitrogen value than either higher-input treatment despite its smaller non-fruit nitrogen pool. N80 occupies a distinct position with 212.9 kg N ha\(^{-1}\) outside fruit and an implied fruit value of approximately 128.83 kg N ha\(^{-1}\).
The fruit fraction is 43.88% at N60, compared with 37.39% at N100 and 38.12% at N120. Expressed against total applied nitrogen, the corresponding fruit/input ratios are 37.54%, 28.53%, and 26.79%. These ratios answer different questions: the first describes partitioning within the crop, while the second compares fruit nitrogen with counted external fertilizer. Their joint decline from N60 to the two higher treatments indicates that the difference is visible under both accounting choices. It does not imply a measured change in fruit protein concentration, because fresh yield and fruit nitrogen concentration are not supplied as paired numerical observations for these calculations.
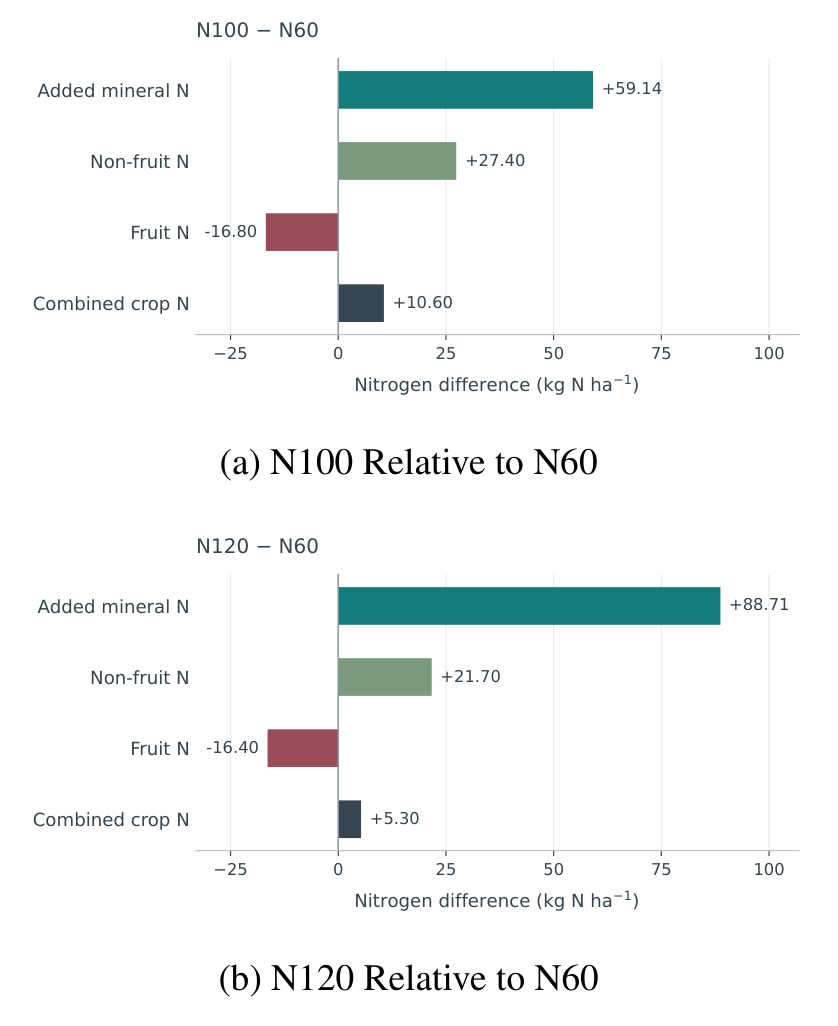
The contrasts in Table 3 and Figure 3 identify where the additional crop nitrogen resides. N60 to N100 adds 59.14 kg mineral N ha\(^{-1}\), accompanied by 27.4 more in non-fruit material and 16.8 less in fruit. Their sum is a crop increase of only 10.6 kg N ha\(^{-1}\), or 17.92% of the additional nominal mineral dose. N60 to N120 adds 88.71 kg N ha\(^{-1}\), with 21.7 more outside fruit and 16.4 less in fruit, giving 5.3 more in the crop total, equivalent to 5.97% of the added dose. Negative fruit differences are treatment-level associations; they are not negative fertilizer-origin recovery fractions.
The N60 to N80 contrast adds 29.57 kg N ha\(^{-1}\) and gives an implied crop increase of 22.03, consisting of 33.5 more in the non-fruit compartment and approximately 11.47 less in fruit. Dividing the non-fruit difference alone by the added dose gives 113.29%. This quantity can exceed 100% because it compares total compartment nitrogen across treatments, including nitrogen of unlabelled origin. Its numerical value provides a concrete reason to keep a difference calculation separate from a fraction of labeled fertilizer recovered. No movement of those 33.5 kilograms from a particular fertilizer or soil pool is identified by the contrast.
| Comparison | \(\Delta F\) | \(\Delta V\) | \(\Delta H\) | \(\Delta U\) | \(\Delta U/\Delta F\) (%) |
|---|---|---|---|---|---|
| N60 \(\rightarrow\) N80 | 29.57 | 33.5 | -11.47\(^{\dagger}\) | 22.03\(^{\dagger}\) | 74.51\(^{\dagger}\) |
| N60 \(\rightarrow\) N100 | 59.14 | 27.4 | -16.8 | 10.6 | 17.92 |
| N60 \(\rightarrow\) N120 | 88.71 | 21.7 | -16.4 | 5.3 | 5.97 |
Nitrogen differences are in kg N ha\(^{-1}\) and equal the destination treatment minus N60. The final column divides the finite crop-N difference by the added nominal mineral dose. \(^{\dagger}\)Values depend on the implied N80 fruit mass. These are arithmetic contrasts between aggregate treatment values; they do not constitute statistical tests or estimates of a continuous dose response.
Apparent crop recovery calculated from the numerical treatment masses and nominal mineral doses equals 49.88% for N40, 73.61% for N60, approximately 73.84% for N80, 51.34% for N100, and 39.79% for N120. These calculations form an explicitly defined arithmetic series; they do not claim to reproduce graphical bar heights obtained from unspecified unrounded observations. The nominal central difference between N80 and N60 is only 0.23 percentage points, much smaller than the separation of either treatment from N100 or N120.
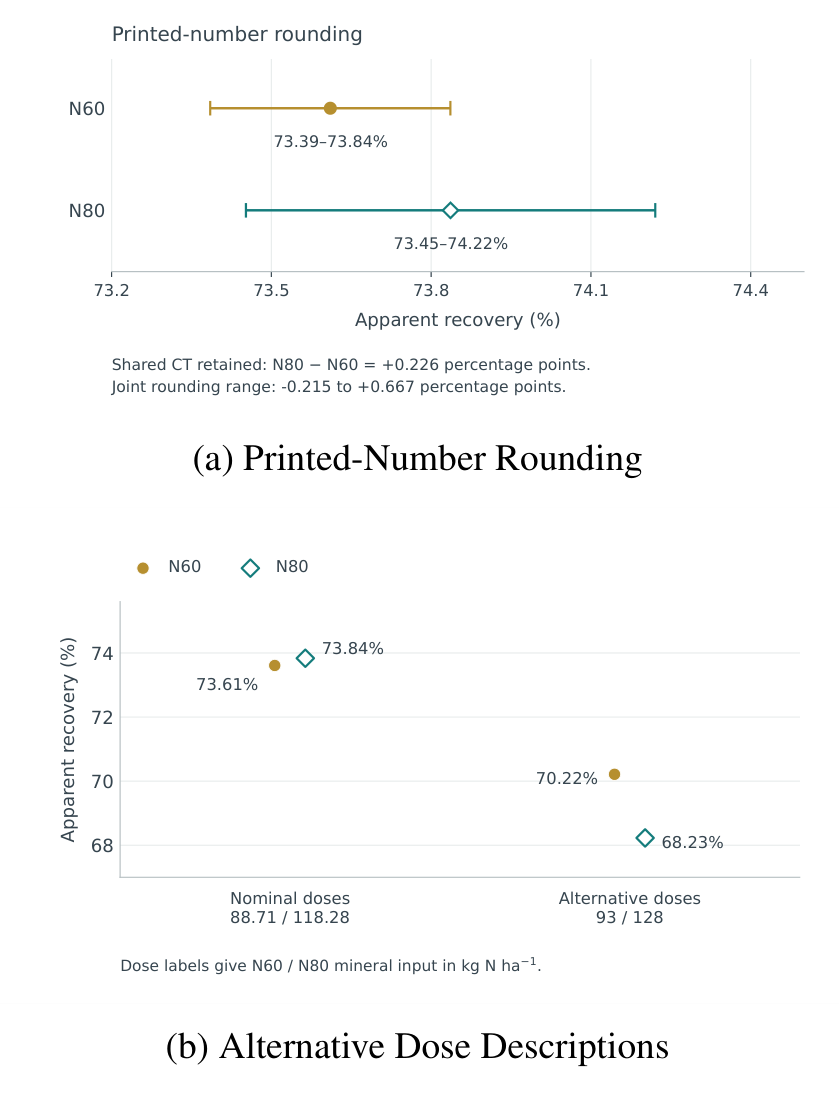
The rounding comparison in Figure 4 shows N60 between 73.385% and 73.836%, and N80 between 73.452% and 74.221%. Their overlap means that their nominal central ordering is not secure even against displayed-number precision. N80’s wider interval arises from the algebraic conversion of a rounded percentage and a rounded plant mass, rather than from a larger measured biological variance. The corresponding implied fruit interval is 128.529–129.138 kg N ha\(^{-1}\). Every point and interval for that treatment retains this qualification.
Using the alternative printed doses of 93 and 128 kg N ha\(^{-1}\) changes the central apparent recoveries to 70.22% for N60 and 68.23% for N80 while holding crop masses fixed. Their central ordering reverses. The total-input reduction relative to N100 likewise becomes 12.67% for N60 and 4.59% for N80 under those dose descriptions. These are denominator sensitivities, not results from additional fertilizer treatments. In contrast, the directly stated fruit differences between N60 and N100 or N120 retain their sign because changing an input denominator does not alter their compartment masses.
Directly bounding the N80 minus N60 recovery difference with their shared CT value gives approximately \(-0.215\) to \(+0.667\) percentage points. Both signs remain admissible. Thus the inability to select a unique ordering follows from a joint calculation, not merely from visual overlap between separately displayed intervals. The much larger N60 to N100 fruit difference retains a negative sign throughout the stated mass-rounding limits, between \(-16.9\) and \(-16.7\) kg N ha\(^{-1}\). This is arithmetic stability of the printed comparison, not evidence of its sampling significance.
The positive arithmetic remainder \(I-U\) is 30.60 kg N ha\(^{-1}\) in CT, 54.01 in N60, 102.55 in N100, and 137.42 in N120. Its increase from N60 to N100 is 48.54 kg N ha\(^{-1}\), and from N60 to N120 is 83.41. These quantities describe additional input not matched by additional nitrogen in the two measured crop compartments. They do not assign that nitrogen to drainage, gaseous emission, residual mineral nitrogen, or immobilized organic forms.
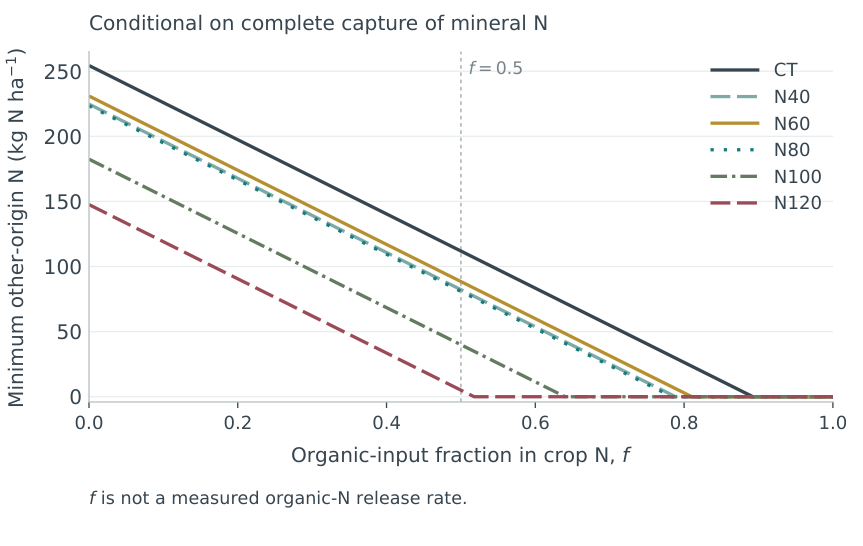
The conditional curves in Figure 5 make the role of amendment contribution explicit. If half of the 285 kg organic N ha\(^{-1}\) appears in the crop and the complete mineral dose is captured, the minimum additional contribution is 111.90 kg N ha\(^{-1}\) for CT, 88.49 for N60, 39.95 for N100, and 5.08 for N120. For N60, the organic contribution threshold is \(f^{*}=0.8105\). Thus, even under complete mineral capture, current organic fertilizer would need to contribute about 81.05% of its total nitrogen to eliminate the arithmetic need for other nitrogen origins.
The curves all reach zero within the allowed contribution interval, but that mathematical result does not establish that any treatment achieved its threshold. At the other endpoint, assigning no current-amendment contribution yields an additional requirement of 230.99 kg N ha\(^{-1}\) for N60. The wide conditional range identifies why a measured amendment contribution is consequential. The topsoil properties correspond to a total nitrogen inventory of 3159 kg N ha\(^{-1}\) over 0–20 cm, based on 2.34 million kilograms of soil per hectare. That inventory makes an appreciable pre-existing pool physically plausible while supplying no estimate of how much was available during the crop.
The two terminal compartment recoveries, each printed as 13.8%, give a combined labeled-fertilizer recovery of approximately 27.6%. Figure 6 displays the measured-compartment allocation and the 72.4% remainder left unassigned. Rounding each printed recovery by 0.05 percentage points gives a combined interval of 27.5–27.7%. This precision interval does not include uncertainty in the fertilizer denominator, laboratory measurements, spatial heterogeneity, or unmeasured plant material. The complement is outside the two reported recovery compartments, rather than a measured environmental loss.
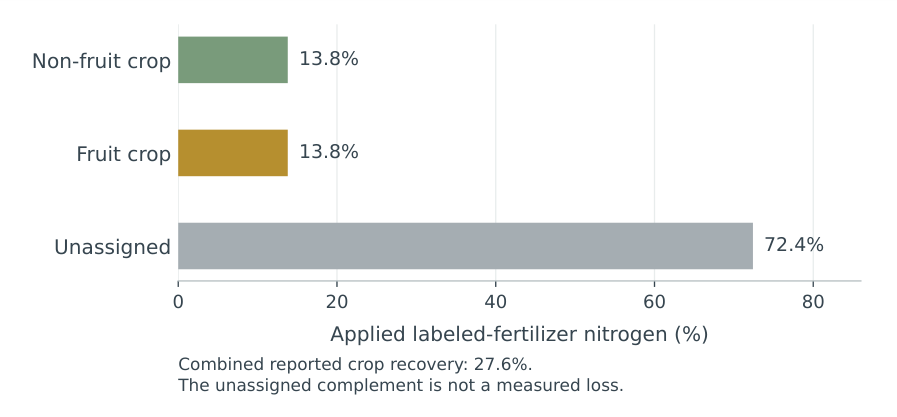
The direct terminal plant value of 20.2 kg urea-derived N ha\(^{-1}\) would equal 13.66% of 147.85 kg N ha\(^{-1}\), which does not reproduce 13.8% at the displayed precision. Table 5 records the decision to retain percentage-based attribution separately from that mass. Likewise, the tracer fruit nitrogen of 116.5 kg N ha\(^{-1}\) is not substituted for the 123.5 kg N ha\(^{-1}\) fruit value in the N100 treatment comparison. Both values can describe their respective observation streams without being interchangeable measurements of the same sampled population.
The selected tracer masses provide limited temporal context for the terminal account. Non-fruit urea-derived nitrogen was 0.9 kg per hectare at day 21, 7.4 at day 50, 7.2 at the printed day 115, and 20.2 at day 178. The late increase is compatible with continued fertilizer-derived accumulation, but does not show that all of that nitrogen originated in applications made during the same interval. Earlier applications could remain available, and internal transfers can change compartment stocks. The observations therefore support temporal description of the existing fertilizer regime without demonstrating the response to postponing, withholding, or redistributing a specified quantity of fertilizer across developmental stages.
The daily schedule in Table 4 integrates to 96.9854 L per plant, equivalent to 320.0518 mm over the stated density. Flowering accounts for approximately 53.15% of this nominal water total, fruiting for 41.81%, and the seedling period for 5.03%. These shares describe scheduled allocation, not measured drainage or crop water consumption. The same integration yields 119.8032 kg elemental P ha\(^{-1}\) and 805.3386 kg elemental K ha\(^{-1}\). Because these totals and the stated oxide fertilizer quantities do not reconcile under unit conversion alone, neither is used to infer a nutrient response coefficient. The dated sampling record is also retained without fitting a daily nitrogen-uptake curve, avoiding false temporal precision where printed dates and day labels differ.
| Stage | Days | Water | Water total | P | K |
|---|---|---|---|---|---|
| (L plant\(^{-1}\) day\(^{-1}\)) | (mm) | (kg ha\(^{-1}\)) | (kg ha\(^{-1}\)) | ||
| Seedling | 30 | 0.1627 | 16.11 | 14.06 | 22.57 |
| Flowering | 88 | 0.5858 | 170.12 | 64.76 | 408.01 |
| Fruit | 54 | 0.7510 | 133.83 | 40.99 | 374.75 |
| Total | 172 | – | 320.05 | 119.80 | 805.34 |
Daily quantities and stage durations are credited to Wang et al., Table 3. Totals use 33,000 plants ha\(^{-1}\) and application on every listed day; they describe the nominal schedule, not metered delivery. P and K are elemental nutrient masses. Totals are calculated before rounding.
Counting organic amendment changes the meaning of treatment comparisons. The reduction from N100 to N60 removes 59.14 kg N ha\(^{-1}\), whether the denominator is mineral fertilizer or combined fertilizer inputs. Its relative size, however, changes from 40.00% to 13.66% when the common 285 kg N ha\(^{-1}\) organic addition is included. Correspondingly, the 20.00% mineral reduction from N100 to N80 represents only 6.83% of combined inputs. The mineral percentage describes adjustment of one fertilizer component; the combined percentage describes the change in total fertilizer N entering the cropping system. Stating both prevents a treatment label from exaggerating the scale of input reduction. Fertilizer reliance and nitrogen-use efficiency are related but distinct descriptions of an agricultural system [30]. Research addressing organic and mineral fertilization together similarly requires explicit accounting of their separate contributions [31].
The organic addition also determines the interpretation of CT. Its crop uptake of 254.4 kg N ha\(^{-1}\) occurred without mineral fertilizer, but with a substantial organic N input. That uptake therefore cannot be assigned entirely to pre-existing soil N. The presence of 285 kg N ha\(^{-1}\) in the amendment does not establish that this quantity became available during the crop cycle. Organic fertilizer mineralization varies with material composition and incubation conditions, so a single availability coefficient cannot be transferred to the present amendment without supporting measurements [11]. The conditional contribution calculation retains this uncertainty explicitly instead of choosing an unsupported mineralization percentage.
At N60, an assumed crop contribution fraction of 0.50 leaves 88.49 kg N ha\(^{-1}\) of crop uptake requiring other N sources, even under the favorable assumption that the crop recovered all mineral fertilizer and the assumed contribution of amendment N. The resulting requirement is a conditional lower bound, not a measurement of soil mineralization. The threshold of approximately 0.8105 identifies the organic contribution fraction that removes the conditional lower bound under those same assumptions. It does not estimate the amendment’s actual release. Likewise, the calculated 3159 kg N ha\(^{-1}\) total N stock in the upper 20 cm establishes the size of a soil pool rather than its seasonal supply. These distinctions are necessary because amendment substitution can alter both crop production and environmental outcomes, with responses depending on how the mineral and organic components are combined [9].
The organ comparison provides a more specific answer than total uptake alone. Relative to N60, N100 supplied an additional 59.14 kg N ha\(^{-1}\) while the plant compartment contained 27.4 kg N ha\(^{-1}\) more N and the fruit compartment contained 16.8 kg N ha\(^{-1}\) less. The net increase in combined crop N was therefore only 10.6 kg N ha\(^{-1}\). With N120, an additional 88.71 kg N ha\(^{-1}\) accompanied a plant increase of 21.7 kg N ha\(^{-1}\) and a fruit decrease of 16.4 kg N ha\(^{-1}\), leaving a combined increase of 5.3 kg N ha\(^{-1}\).
The observed distribution is consistent with greater N accumulation in non-fruit tissues at higher inputs, but the aggregate values do not identify the physiological mechanism. Increased tissue N concentration, altered biomass distribution, differences in fruit development, and changes in N remobilization could contribute separately or together. Without repeated organ-specific biomass and concentration measurements that resolve these processes, the calculation supports a description of allocation rather than a causal explanation. Four-season greenhouse tomato research has measured organ growth, fruit dry matter, yield, and soil nitrate together, illustrating the broader observation set required to connect uptake patterns with production consequences [32].
Fruit N accumulation also should not be equated with fresh fruit yield, commercial quality, or economic return. A higher fruit N stock can reflect changes in dry matter or N concentration without a proportional change in fresh mass. N60 contained the largest directly stated fruit N quantity among the treatments, whereas the reconstructed N80 value depends on its rounded allocation percentage. The present result therefore identifies an allocation contrast whose practical value remains conditional on the intended production objective. Tomato studies that consider fruit quality and cultivation profit demonstrate why these outcomes require independent measurement [14]. Processing-tomato evidence further supports distinguishing N demand and crop growth from the final production objective, while its rates cannot be transferred directly to this protected fresh-market crop [33].
The difference calculation expresses additional crop N relative to CT per unit of mineral fertilizer. It does not identify which N atoms originated in that fertilizer. At N60, the 65.3 kg N ha\(^{-1}\) increase in combined uptake gives an apparent recovery of 73.61% under the nominal rate. This is a useful description of the uptake response under common organic amendment, but it includes any treatment-associated change in the acquisition of unlabeled N. A fertilizer-induced change in access to amendment or soil N can therefore affect the numerator. Apparent recovery has a direct agronomic precedent in tomato research, provided that its interpretation remains tied to the difference between fertilized and comparison treatments [12].
Isotope recovery instead follows labeled fertilizer into the sampled compartments. In the separate tracing experiment, the day-178 values of 13.8% in plants and 13.8% in fruits sum to 27.6%. This percentage cannot be subtracted from the N60 apparent recovery to calculate an error, an unobserved loss, or a contribution from soil N: the quantities represent different estimands and different experimental records. Work distinguishing applied and residual fertilizer N through \(^{15}\)N measurements in tomatoes illustrates the need to retain the identity of the traced input [34]. Even a biologically plausible relationship between the two recovery measures does not justify replacing one with the other.
The 72.4% complement of day-178 crop recovery identifies labeled N outside the two reported crop compartments at that observation time. Crop recovery differs from combined crop-and-soil recovery, a distinction also emphasized in \(^{15}\)N field syntheses [35]. The complement could include soil-retained N, N in unmeasured material, and N transported beyond the observed compartments; their contributions cannot be established here. Long-term tracing has demonstrated soil retention and subsequent movement of fertilizer N in other cropping systems [36], while reviews document its residual value for later crops [37]. The complement therefore remains unassigned. Measured leaching requires drainage and N concentration observations, as demonstrated by greenhouse studies that directly assessed these fluxes [17].
The same separation applies to mass calculations. The tracing experiment is described as receiving the conventional mineral rate, yet its printed mass and recovery percentage do not reconcile under that nominal denominator. The day-178 plant fertilizer-N amount and its rounded recovery percentage do not reconcile exactly with the nominal plot rate. The discrepancy remains an identification limit, and retaining the reported percentage avoids inventing a denominator reconciliation. Likewise, the tracing experiment’s fruit N cannot substitute for the plot experiment’s N100 fruit N.
The nominal apparent recoveries place N60 and N80 close together, at 73.61% and approximately 73.84%, respectively. Their separation is only about 0.23 percentage points. Allowing for the precision of the printed inputs produces overlapping admissible ranges: approximately 73.39–73.84% for N60 and 73.45–74.22% for N80. These ranges describe rounding compatibility rather than confidence intervals; they say nothing about between-plot variability. Nonetheless, they establish that the numerical precision is insufficient to support a unique ordering of these two apparent recoveries.
The rate discrepancy strengthens this conclusion. Using 93 and 128 kg N ha\(^{-1}\) for N60 and N80 instead of the nominal multiples gives approximately 70.22% and 68.23%, reversing their point ordering. This arithmetic does not validate the alternate rates. It shows that an unresolved denominator affects the treatment designation more strongly than the difference between the nominal recovery estimates. In contrast, the much lower nominal apparent recoveries at N100 and N120 remain well separated from N60 across the specified rounding ranges. The defensible emphasis is therefore the contrast with higher mineral input, rather than a narrowly selected recovery maximum.
The N80 fruit quantity has an additional limitation because it is reconstructed from the stated plant quantity and fruit allocation percentage. Its admissible interval, approximately 128.529–129.138 kg N ha\(^{-1}\), makes the dependence on rounding visible. Reporting this interval does not convert the reconstruction into a direct measurement. Nor can digitized bar heights or treatment means recover the covariance, residual variation, and replication-level structure needed for a fresh statistical test.
| Quantity | Available descriptions | Treatment in this analysis |
|---|---|---|
| N60 and N80 doses | Nominal 88.71 and 118.28; abstract 93 and 128 kg N ha\(^{-1}\) | Percentage-derived doses in the main calculation; alternative endpoints in a separate sensitivity check. |
| N80 fruit nitrogen | Plant N 212.9 kg ha\(^{-1}\) and fruit fraction 37.7% | Algebraically implied fruit mass and rounding limits; no claim of a directly printed mass. |
| N120 fruit fraction | Printed 38.3%; component masses 201.1 and 123.9 kg N ha\(^{-1}\) | Component-based 38.12%; the two descriptions are not silently treated as identical. |
| Terminal tracer recovery | Plant mass 20.2 kg N ha\(^{-1}\); each compartment recovery 13.8% | Recovery percentages summed separately; no forced mass–denominator reconciliation. |
| Sampling time | 7 and 19 March 2020 imply elapsed days 117 and 129 from 11 November 2019; graphs label 115 and 130 | Dated record retained; no fitted daily uptake rates. |
| P and K addition | Daily elemental schedule and season-level oxide totals differ | Scheduled elemental integrals stated separately; no nutrient-response inference. |
The numerical choices in Table 5 distinguish limitations that change a calculation from those that restrict its interpretation. The conflicting mineral doses change recovery denominators and therefore warrant an explicit sensitivity comparison. The N80 fruit percentage changes the precision of an implied compartment mass. By contrast, the N120 fruit fraction can be checked directly against its two stated masses: 123.9 divided by 325.0 gives 38.12%, and rounding those masses permits approximately 38.108–38.138%, which does not reach the printed 38.3%. The calculation therefore consistently retains the component masses. This choice prevents a small internal inconsistency from being propagated as an independently confirmed allocation value.
The calendar and nutrient schedule require a different response. Their inconsistencies do not affect the terminal treatment contrasts, but they prevent precise reconstruction of daily delivery and uptake. Omitting unidentifiable daily rates preserves the terminal evidence without implying that the entire cultivation history is known. An analysis can consequently reach a definite conclusion about the printed compartment differences while remaining unable to estimate a continuous uptake trajectory, a fertilizer release coefficient, or a seasonally closed nitrogen balance. These are different evidential requirements, and treating them separately preserves the useful numerical conclusions.
The available fresh-yield account, approximately 91–110 t ha\(^{-1}\) without a detected treatment difference, does not establish yield equivalence. It also cannot identify an economic optimum, because treatment-specific uncertainty and the required price and cost information are unavailable. The strongest supported result is narrower: N100 and N120 used substantially more mineral N than N60 while showing small additional combined crop N accumulation and lower fruit N accumulation. This identifies treatments for further agronomic evaluation without asserting that a lower rate has already been shown to preserve every production outcome. Optimization studies distinguish yield, water productivity, N efficiency, and quality precisely because these objectives can favor different management choices [13].
The evidence does not justify a stage-specific fertilizer schedule. Temporal changes in isotope recovery describe where labeled N accumulated during the observed management, rather than what would happen if fertilizer were withheld or redistributed. Changes in fertigation frequency can affect uptake and crop performance, but those effects require a direct treatment comparison [38]. Tracer uptake also varies with irrigation pattern and nitrate placement [19]. Soil and crop N monitoring would therefore be needed before translating the present allocation and recovery results into timing decisions [21].
Environmental interpretation is similarly bounded. Reduced combined input lowers the quantity of N introduced to the system, but does not measure reduced nitrate leaching or gaseous emission. Tracing in fertilized loamy soil has also identified substantial contributions of soil organic N to leached nitrate [39]; fertilizer tracing alone therefore does not describe all leaching sources. Irrigation amount can strongly influence leaching in protected vegetable production [18]; neither crop uptake differences nor a total soil N stock resolves that transport. Fertilization history can affect current fertilizer fate, as shown in continuous maize, without specifying a transferable tomato response [40]. Because the record concerns one cultivar and one greenhouse crop cycle, the numerical contrasts cannot define a general rate for Shouguang or other regions. They establish which conclusions survive explicit input accounting, compartment separation, and reported numerical precision, and which require additional observations.
Explicitly counting organic N and separating fruit allocation from total crop uptake changes the interpretation of higher mineral N input in the Shouguang tomato record. Relative to N100, N60 reduced mineral fertilizer by 40.00%, but combined mineral and organic input by only 13.66%, because every treatment received 285 kg N ha\(^{-1}\) in organic amendment. Compared with N60, N100 received 59.14 kg N ha\(^{-1}\) more mineral fertilizer and contained only 10.6 kg N ha\(^{-1}\) more combined crop N; plant N was 27.4 kg N ha\(^{-1}\) greater while fruit N was 16.8 kg N ha\(^{-1}\) smaller. Higher total uptake therefore did not represent greater fruit N accumulation.
N60 and N80 could not be uniquely ranked by apparent recovery because their rounding-compatible ranges overlapped and the alternate stated rates reversed their point ordering. The nominal calculation placed both above N100 and N120, but did not establish a yield or economic optimum. The separate tracing experiment gave 27.6% combined crop recovery at day 178; the remaining 72.4% was unassigned and cannot be classified as loss. Apparent and isotope recovery consequently support distinct conclusions and must retain their respective denominators and experimental identities.
The research question is thus answered by the accounting boundary: N100 and N120 contained only 10.6 and 5.3 kg N per hectare more combined crop nitrogen than N60, with more non-fruit nitrogen and less fruit nitrogen. Their relative change in total fertilizer input was smaller than the mineral treatment labels suggested. These findings support scrutiny of higher mineral rates under the recorded organic addition. They do not prescribe a general fertilizer rate, establish fresh-yield equivalence, quantify environmental loss, or determine a fertilization schedule.
The treatment-level numerical dataset, input provenance, calculation script, plotting script, and figure files accompany this manuscript. The measurement record is identified in Section II. The accompanying files contain calculated aggregate quantities and no individual-plant observations. Running python3 scripts/analyze.py followed by python3 scripts/make_figures.py regenerates the numerical outputs and figures.
The author declares no conflicts of interest.
The author received no specific funding for this research.
OpenAI ChatGPT assisted with plotting code. Numerical figures were produced programmatically from the documented inputs.